Visa (NYSE:) Technical Analysis: Earnings in Focus as Bullish Momentum Builds
$364.68
28 Jul 2026, 15:59
Neutral

Join Minipip Academy and access free courses in investing, trading, economics, and more.
Sign Up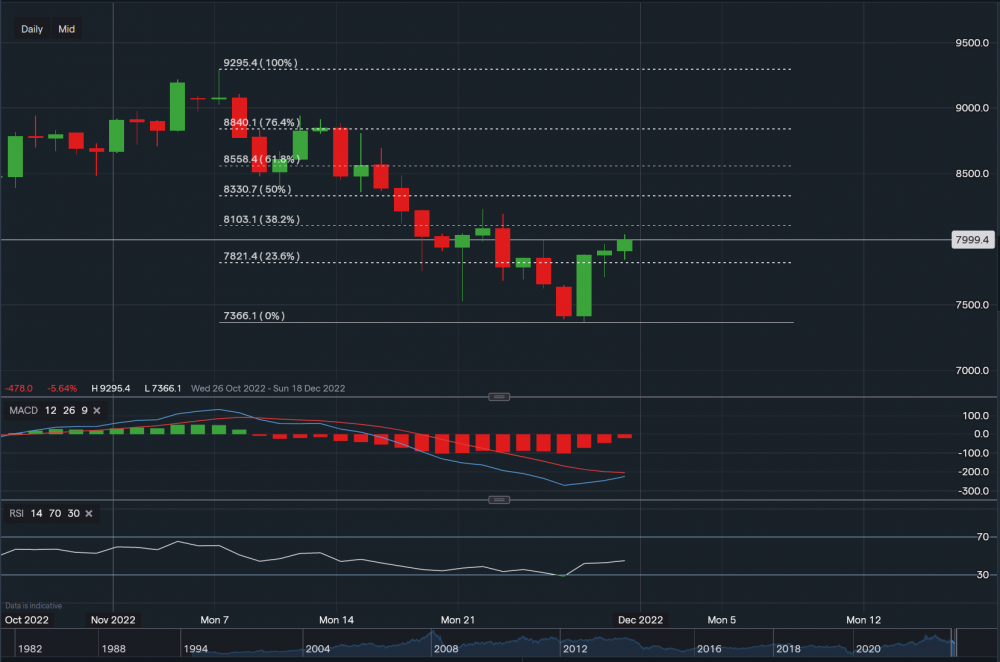
US Crude Oil - Chart & Data from IG
Taking a look at US Crude oil in this instance, from a technical perspective it is currently trading at $79.99 a barrel. Oil has been in a downtrend since the 8th of November, but a big break at the beginning of the week on Monday may have created some momentum towards the upside. Applying the Fibonacci retracement to the chart, towards the upside resistance sits at $81.03 (38.2% fib) then at $82.31 (peak of the green candlestick in between the 38.2% and 50% fib’s), then at $83.30 (50% fib). A break above the 50% fib level could see oil climb back towards the $88-$90 a barrel price range. However, it is important for investors to monitor ongoing situations in China, with China being the world’s largest crude importer, as it has a major influence on this market.
Additionally, crude oil inventories are set to be released later today, which could also impact the price of oil. Towards the downside, support sits at $79.09 then at $78.21 (23.6% fib) then at $76.92. A break below these support points may see oil retreat and fall back towards the $73.66 price level. Looking at the indicators, MACD is currently negative but heading towards a positive position and RSI is neutral as it reads 45.
 Earnings Calendar
  Economic Calendar
  VAT Calculator
  Tax Free Childcare Calculator
 Percentage Calculator
 Compound Interest Calculator
  Loan Overpayment Calculator
 Mortgage Calculator
 Credit Card Calculator
 Investing
  Economics
 Trading
  Technical Analysis
  Personal Finance
 Calculator


