UnitedHealth Group Analysis: Defensive Healthcare Scale Amid Regulatory and Margin Pressures
$407.34
12 Jun 2026, 17:06
Neutral

Join Minipip Academy and access free courses in investing, trading, economics, and more.
Sign Up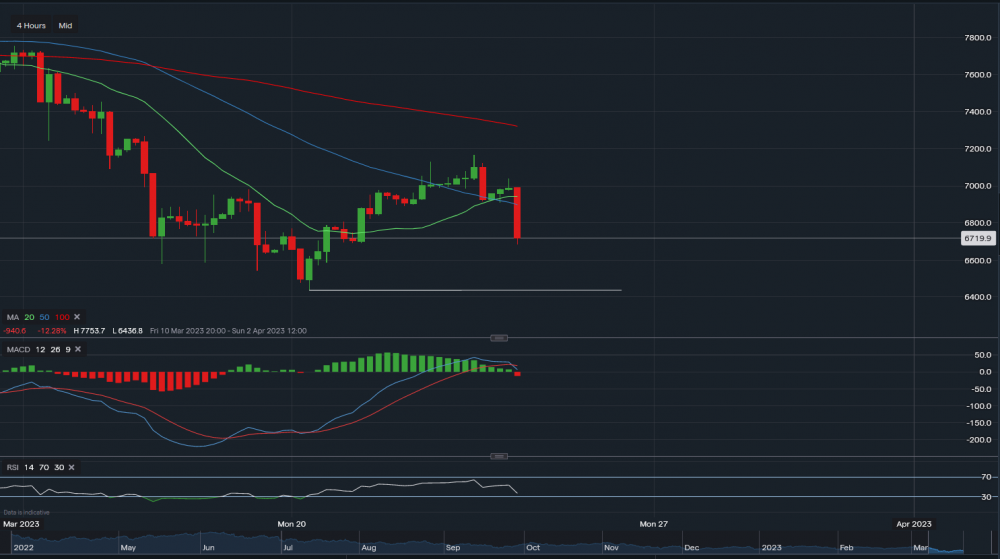
Chart & Data from IG
Crude oil with a big decline in today’s European trading session. Crashing through the 20-day MA and the 50-day MA on the 4-hourly timeframe, wiping Tuesday-Thursday’s gains. At present, trading at around $67.19 a barrel. Further support sits $66.91 followed by a major level at $64.36. A break and close below the major support level may see the price of crude slide further towards $63 a barrel. However, at the US open if consolidation is found, previous support levels of $68.57 and $68.97 are now acting as resistance. A break and close above these points could see the price edge back up towards the $70 mark. Nevertheless, the bias is currently bearish as the indicators are faltering. MACD has turned negative and RSI is also negative as it reads 37.
 Earnings Calendar
  Economic Calendar
  VAT Calculator
  Tax Free Childcare Calculator
 Percentage Calculator
 Compound Interest Calculator
  Loan Overpayment Calculator
 Mortgage Calculator
 Credit Card Calculator
 Investing
  Economics
 Trading
  Technical Analysis
  Personal Finance
 Calculator


