Visa (NYSE:) Technical Analysis: Earnings in Focus as Bullish Momentum Builds
$364.68
28 Jul 2026, 15:59
Neutral

Join Minipip Academy and access free courses in investing, trading, economics, and more.
Sign Up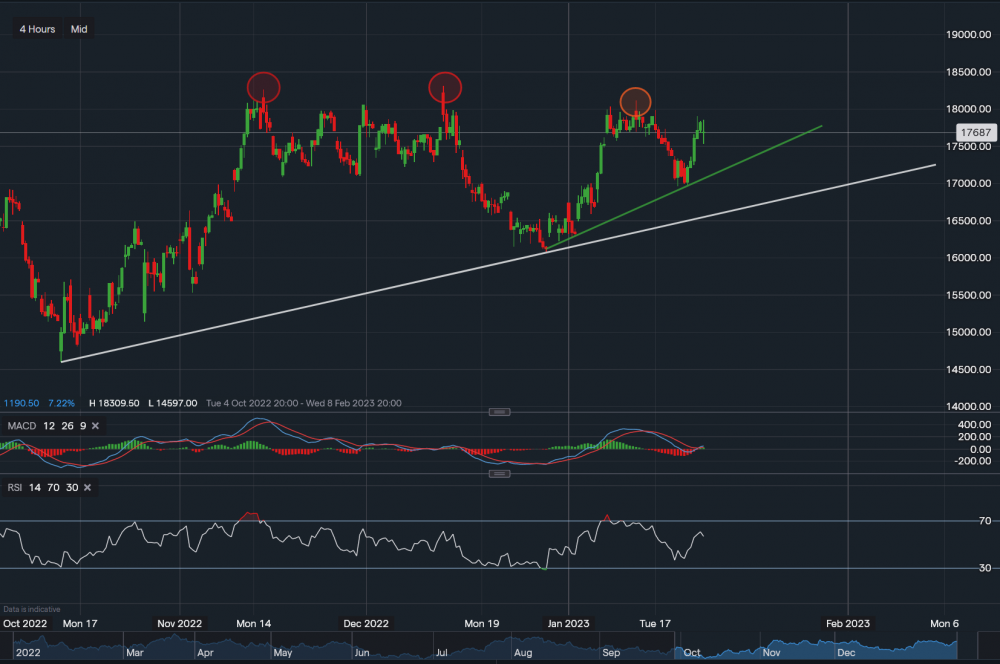
Texas Instruments - Chart & Data from IG
Technicals
From a technical aspect, the stock’s share price currently sits around $176.87 a share. As highlighted on the chart, support seems to be established along the trendlines with key levels sitting at $172.27 (green trendline) and then at $167.76 (white trendline). A break below the white trendline could form a bearish trend, leading to a much lower slide towards the $160 mark. After the market close, Texas instruments is set to report quarterly earnings of $2 on revenue of $4.65bn. Therefore, this may have an influence on the price of its stock if the report is positive. Towards the upside, resistance sits at $179.02 and then followed by some key levels at $181.13 (orange oval) and at $183.09 (red oval). A break above the red ovals could see the price climb near the $186 range. On the basis of the technical indicators, on the 4 hourly timeframes, the MACD has just turned positive and RSI remains positive as it reads 57.
 Earnings Calendar
  Economic Calendar
  VAT Calculator
  Tax Free Childcare Calculator
 Percentage Calculator
 Compound Interest Calculator
  Loan Overpayment Calculator
 Mortgage Calculator
 Credit Card Calculator
 Investing
  Economics
 Trading
  Technical Analysis
  Personal Finance
 Calculator


