Visa (NYSE:) Technical Analysis: Earnings in Focus as Bullish Momentum Builds
$364.68
28 Jul 2026, 15:59
Neutral

Join Minipip Academy and access free courses in investing, trading, economics, and more.
Sign Up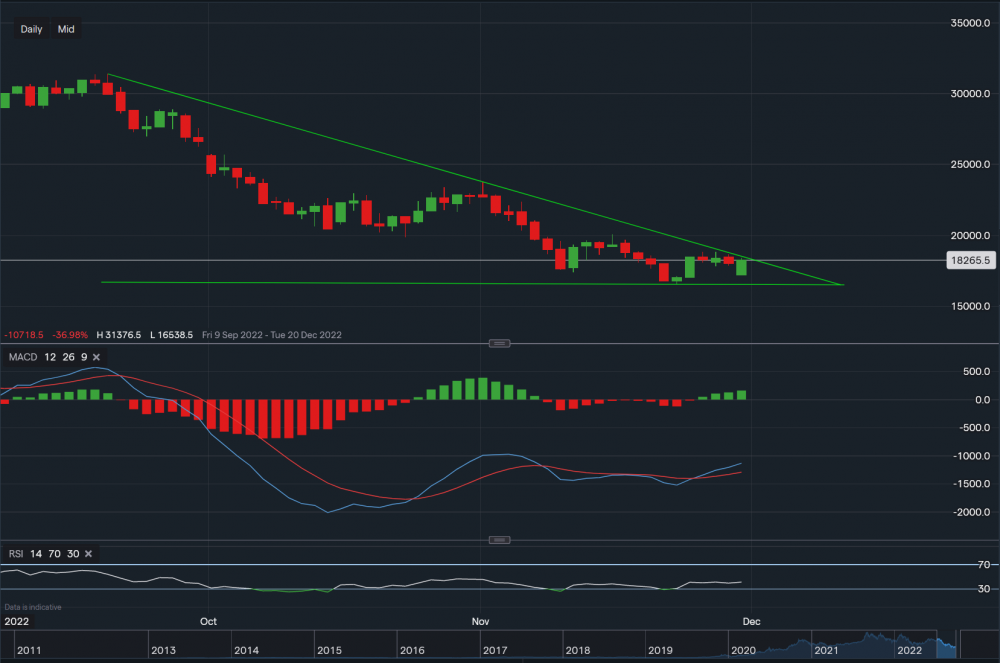
Tesla Inc - Chart & Data from IG
Overview
Tesla, Inc. is a multinational American vehicle and clean energy corporation with its headquarters in Austin, Texas. Tesla develops and produces electric cars, battery energy storage systems for homes and large-scale grids, solar panels, solar roof tiles, and related goods and services.
Financials
Looking at the financials of the company, 2021 versus 2020. In 2021 the revenue jumped from $31.5bn to $53.8bn and gross profit went up from $6.6bn to $13.6bn. EBITDA rose by $5.1bn and net income came in at $5.5bn, an almost $5bn increase from the prior year. As a result, in 2021 earnings per share went up by $1.62 to $1.87. Taking a look at the total assets to liabilities ratio, total liabilities rose by just over $2bn, however, total assets rose by $10bn. This had a follow-on effect on the equity of the company as it risen to $31bn from $23bn year-on-year.
Technicals
From a technical outlook, Tesla stock is currently trading at $182.68 a share. Towards, the upside, resistance sits at $183.98 then at $185.81 then at $186.87. A break above these levels could see the stock break out of the descending triangle and climb towards the $200 price level. On the other hand, towards the downside, support sits at $178.76 then at $176.56 then at $172.25. A slip below these points may see the share price slide towards the key support at $165.38, which corresponds with the lower trendline of the triangle. Looking at the indicators, MACD has turned positive but RSI is negative as it reads 41. Although at present, it is stable.
Summary
Overall, the financials of Tesla are strong. The company shows strong business growth and financial stability year-on-year and only looks to continue doing so in the future to come. It generates more revenue YoY and operates at a high-profit margin with a healthy cash-on-hand stockpile. Assets outweigh liabilities in all aspects and the jump in EPS in 2021 was very positive compared to the prior year. On the basis of the technicals, the indicators portray a mixed sentiment towards the direction of the share price, however, there is potential for a break out of the descending triangle as a support base looks to have been established. Nevertheless, investors should be wary if placing their bets on long positions as with the current cost-of-living crisis there is a chance that the stock could slip further before year-end. The stock is currently down 54% for the year since January 3rd.
 Earnings Calendar
  Economic Calendar
  VAT Calculator
  Tax Free Childcare Calculator
 Percentage Calculator
 Compound Interest Calculator
  Loan Overpayment Calculator
 Mortgage Calculator
 Credit Card Calculator
 Investing
  Economics
 Trading
  Technical Analysis
  Personal Finance
 Calculator


