UnitedHealth Group Analysis: Defensive Healthcare Scale Amid Regulatory and Margin Pressures
$407.34
12 Jun 2026, 17:06
Neutral

Join Minipip Academy and access free courses in investing, trading, economics, and more.
Sign Up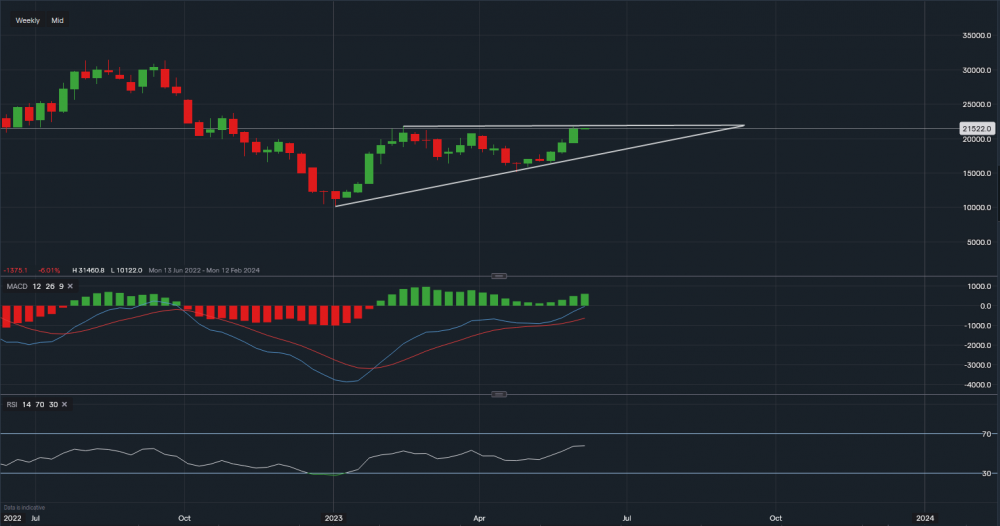
Chart & Data from IG
Taking a look at Tesla as it has been rallying throughout all of May and now approaching a major resistance point on the weekly timeframe. Currently, Elon Musk’s EV company is trading at around $215.22 a share. We can see a slight formation of an ascending triangle, the major resistance sits at $217.84 (upper trendline of the triangle), and a break above this level could create room for further upside. The next upside target would then be $237.35 followed by $250. Although, Tesla is a very volatile stock so investors/traders should be cautious as falls can be as sharp if not sharper than rises. Nevertheless, support now sits at $191.84 and then at $185.46 (along the ascending trendline). A break out of the triangle towards the downside may see the price slide lower, testing the support at $163.96. Looking at the technical indicators, MACD is positive and so is the RSI as it now reads 57. Elon Musk has not acted as fast regarding the AI hype as the rest of the tech giants, or at least it is unknown to the general public. Therefore, if in the near future, there are signs of Tesla implementing AI, then this could create an opportunity for growth. In turn, this may attract more investors.

Tradable assets:
Min.Deposit:
Max Leverage:
FCA:

Rating:
 Earnings Calendar
  Economic Calendar
  VAT Calculator
  Tax Free Childcare Calculator
 Percentage Calculator
 Compound Interest Calculator
  Loan Overpayment Calculator
 Mortgage Calculator
 Credit Card Calculator
 Investing
  Economics
 Trading
  Technical Analysis
  Personal Finance
 Calculator


