Visa (NYSE:) Technical Analysis: Earnings in Focus as Bullish Momentum Builds
$364.68
28 Jul 2026, 15:59
Neutral

Join Minipip Academy and access free courses in investing, trading, economics, and more.
Sign Up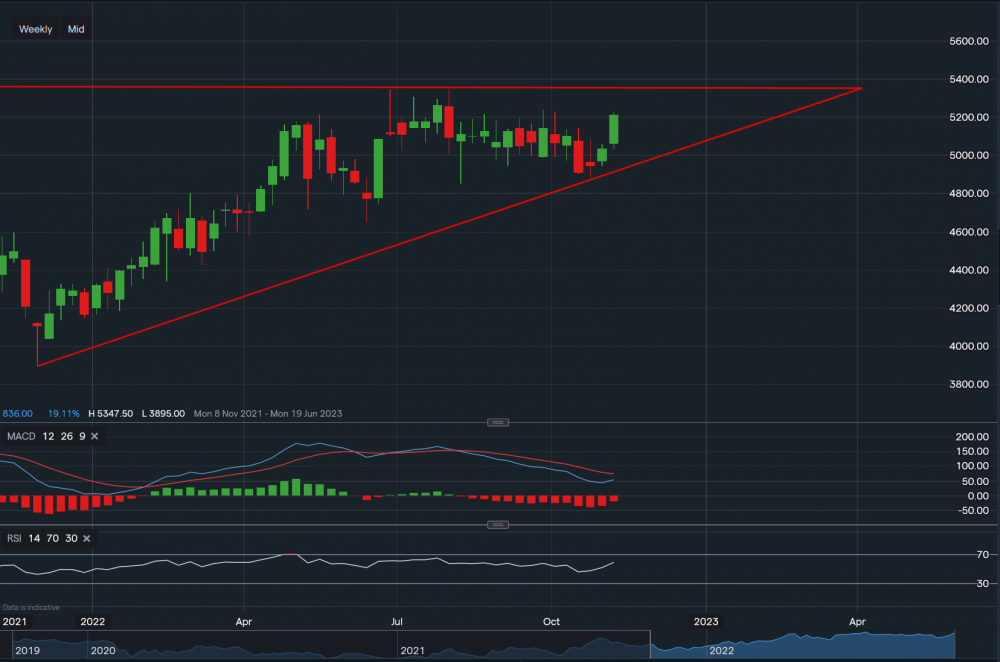
Suntory Beverage & Food Limited - Chart & Data from IG
Overview
Suntory Holdings Limited is a Japanese multinational brewing and distilling company group. The company was first founded in 1899 and it is one of the oldest companies in the distribution of alcoholic beverages in Japan. It also distributes ready-to-drink products such as sugar-free tea and water. The soft drink market in Japan, which Suntory Holdings targets, has been experiencing long-term growth and as a result, the company has benefited. The head office is based in Minato City, Tokyo, Japan.
Financials
Comparing the 2021 financial results to 2020, total revenue grew Ұ90,780bn with gross profit rising Ұ39,326bn year-on-year. Operating income came in at Ұ118,568bn versus Ұ96,177 in the prior year and after all the expenses and tax, profit for the year totalled Ұ83,029bn. This was an Ұ18,735bn increase from the previous year. Earnings per share also rose by Ұ53.28. Total assets grew to Ұ1,676,926 trillion from Ұ1,574,251 trillion and liabilities grew from Ұ714,694bn to Ұ732,974bn, however, the rise in assets offsets the increase in liabilities. This brought the total equity value of the company to Ұ943,952bn (an Ұ84,396bn jump).
Technicals
From a technical overview, its current share price sits at Ұ5,211. Towards the upside, minor resistance sits at Ұ5,238 then further resistance at Ұ5,296 then major resistance at Ұ5,347. A break above the major resistance, which corresponds with the upper trendline of the ascending triangle, could see the stock reach its all-time high. Towards the downside, support levels sit at Ұ5,114 then at Ұ5,067 then at Ұ5,022. A break below these levels may see the stock slide towards the major support at Ұ4,881, which corresponds with the lower trendline of the triangle. Looking at the technical indicators, MACD is currently negative but swaying towards positive and RSI is positive as it reads 59.
Summary
The financials of the company are strong with a solid gradual increase year-on-year. Total equity highlights continuous growth as assets offset liabilities and operating income after expenses is healthy. Earnings per share also rose 23% YoY. Based on the technicals, indicators are slightly mixed but swaying more towards the positive side. The stock is also 41% up since January 4th, a positive earnings report could give it that boost to test the major resistance level. However, a report lower than expectations could see a decline in the opposite direction.
 Earnings Calendar
  Economic Calendar
  VAT Calculator
  Tax Free Childcare Calculator
 Percentage Calculator
 Compound Interest Calculator
  Loan Overpayment Calculator
 Mortgage Calculator
 Credit Card Calculator
 Investing
  Economics
 Trading
  Technical Analysis
  Personal Finance
 Calculator


