Visa (NYSE:) Technical Analysis: Earnings in Focus as Bullish Momentum Builds
$364.68
28 Jul 2026, 15:59
Neutral

Join Minipip Academy and access free courses in investing, trading, economics, and more.
Sign Up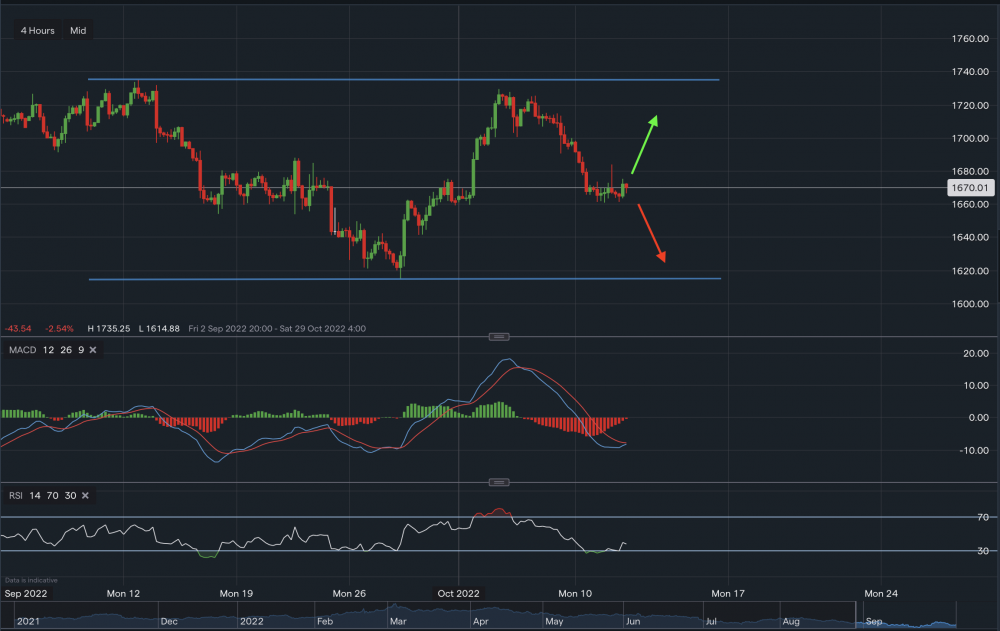
From a technical overview gold is currently trading at $1,670 ahead of the US inflation data this week. After plenty of rallying in the September month and a slight drop in the first week of October, over the last couple of days it has been fairly steady. Looking towards the upside, minor resistance level sits at $1,684 followed by further resistance at $1,700. A break above the $1,700 price level could result in more uptrend towards the major resistance at $1,735 (upper blue trendline). On the other hand, towards the downside if the inflation data is not appealing, minor support sits at $1,659 with further support level at $1,641. A break below $1,641 may result in a price dip towards the major support at $1,614 (lower blue trendline). RSI is currently suggesting a bearish approach as it reads 38, although MACD looks like it is turning positive.
 Earnings Calendar
  Economic Calendar
  VAT Calculator
  Tax Free Childcare Calculator
 Percentage Calculator
 Compound Interest Calculator
  Loan Overpayment Calculator
 Mortgage Calculator
 Credit Card Calculator
 Investing
  Economics
 Trading
  Technical Analysis
  Personal Finance
 Calculator


