Visa (NYSE:) Technical Analysis: Earnings in Focus as Bullish Momentum Builds
$364.68
28 Jul 2026, 15:59
Neutral

Join Minipip Academy and access free courses in investing, trading, economics, and more.
Sign Up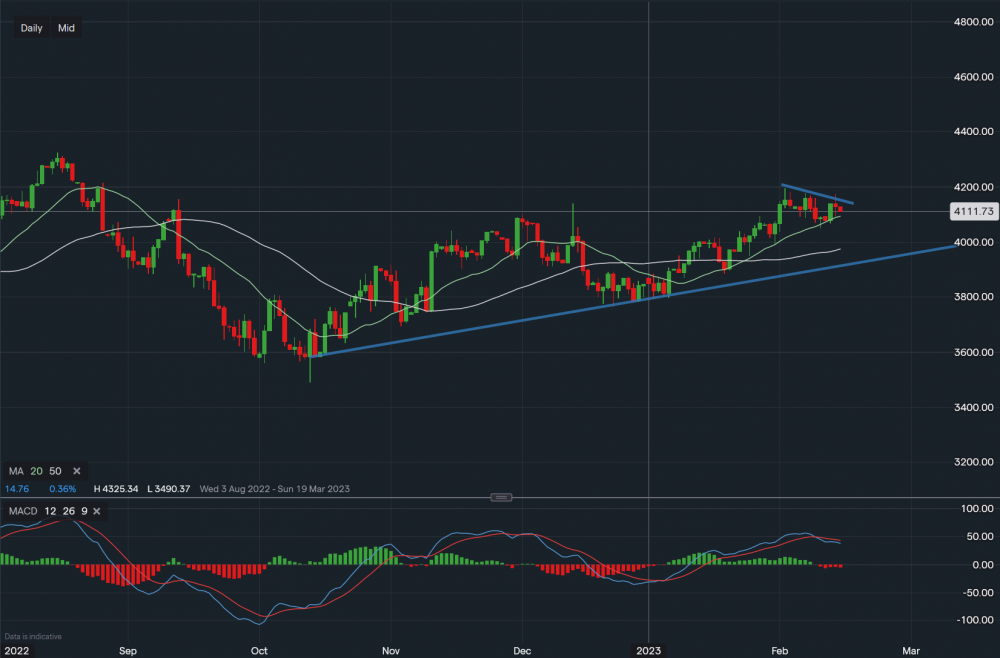
S&P500 - Chart data IG
The S&P struggled for direction after inflation came in at 6.4% vs 6.2% estimate. Previous figures were 6.5%. Therefore at Minipip, while the reading was not as good as expected, it does show inflation is cooling. The UK inflation CPI figure this morning also shows a slowdown as well. Overall this in our view is positive and hence why the market likely didn't 'sell off' significantly. Looking at the S&P500 ample support levels are below. Firstly at 4,093, followed by 4,060, then 3,975 and finally trendline support at 3,920. Towards the upside resistance sits t 4,130 followed by 4,155 and then 4,200. A break above 4,200 could take the S&P up towards 4,314. MACD is trending lower and this will be likely a muted, noisy week.
 Earnings Calendar
  Economic Calendar
  VAT Calculator
  Tax Free Childcare Calculator
 Percentage Calculator
 Compound Interest Calculator
  Loan Overpayment Calculator
 Mortgage Calculator
 Credit Card Calculator
 Investing
  Economics
 Trading
  Technical Analysis
  Personal Finance
 Calculator


