UnitedHealth Group Analysis: Defensive Healthcare Scale Amid Regulatory and Margin Pressures
$407.34
12 Jun 2026, 17:06
Neutral

Join Minipip Academy and access free courses in investing, trading, economics, and more.
Sign Up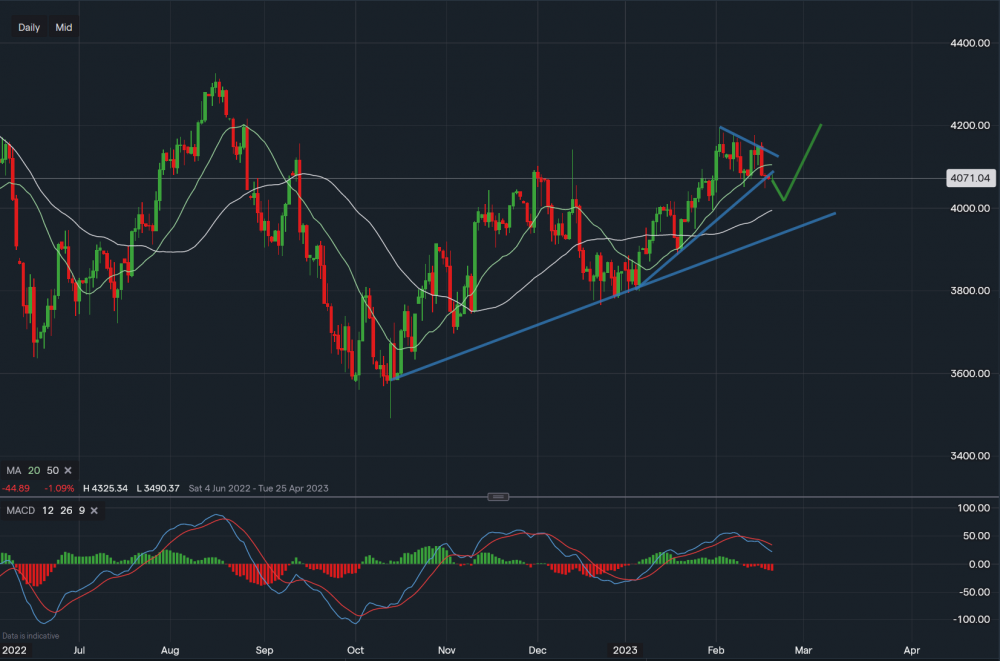
S&P500 - Chart data IG
Hot inflation data has caused the S&P 500 to break trendline support however further support sits below 4000 and then 3,950. Unless the lower trendline breaks the bias is still up. A break of this trendline may cause a large fall further back towards the 2022 yearly low. Looking towards the upside resistance now sits at 4,080 followed by 4,145. A break above here takes the S&P towards 4,200. In our opinion, the market is taking a breaker and while inflation numbers from CPI & PPI were higher than expected, they still showed an overall downtrend YoY and MoM. GDP figures are due later this week and could cause a further fall if below expectations, if GDP is higher than expected, markets could rally back towards the 4,200 regions. MACD on the daily is negative with an RSI reading of 50 suggesting a short-term negative bias, but an upside in the medium term.
 Earnings Calendar
  Economic Calendar
  VAT Calculator
  Tax Free Childcare Calculator
 Percentage Calculator
 Compound Interest Calculator
  Loan Overpayment Calculator
 Mortgage Calculator
 Credit Card Calculator
 Investing
  Economics
 Trading
  Technical Analysis
  Personal Finance
 Calculator


