UnitedHealth Group Analysis: Defensive Healthcare Scale Amid Regulatory and Margin Pressures
$407.34
12 Jun 2026, 17:06
Neutral

Join Minipip Academy and access free courses in investing, trading, economics, and more.
Sign Up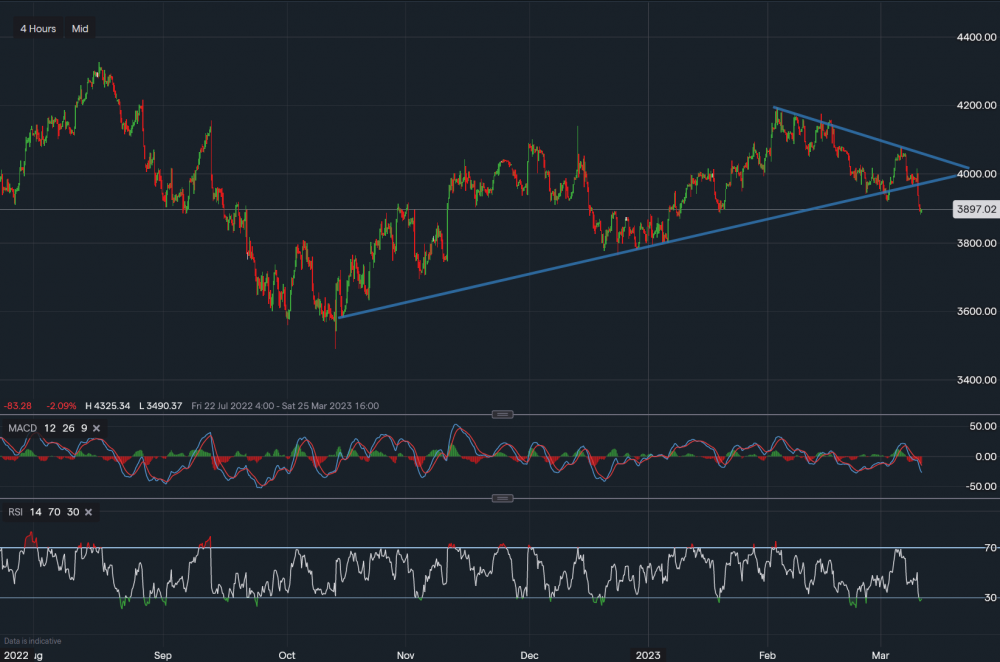
S&P500 - Chart data IG
the S&P fell in Thursday's trading session to clearly break and close below the rising wedge pattern which we identified earlier in the week. Tough resistance now sits at the rising blue line. 4,000 also will play an important physiological resistance. NF Payrolls are due later today at 1:30 pm and a better-than-expected number could actually make the S&P500 and other indices fall further as it would suggest further tightening in monetary policy and interest rates. A worse-than-expected number could see a bounce back toward the swing resistance at 4,000. It is worth noting that the S&P is currently oversold on the 4 hourly timeframe and when this has happened previously the index has seen a bounce given enough time, similar to what the GBPUSD pair we posted saw in recent days. As it's Friday, taking a risk-off approach is important as leaving open positions into the weekend could mean a gap open or drop on Monday. Today does show some good opportunities however in multiple markets. Towards the downside, the next level of support is the 3,776 clusters seen in December 2022.
 Earnings Calendar
  Economic Calendar
  VAT Calculator
  Tax Free Childcare Calculator
 Percentage Calculator
 Compound Interest Calculator
  Loan Overpayment Calculator
 Mortgage Calculator
 Credit Card Calculator
 Investing
  Economics
 Trading
  Technical Analysis
  Personal Finance
 Calculator


