Visa (NYSE:) Technical Analysis: Earnings in Focus as Bullish Momentum Builds
$364.68
28 Jul 2026, 15:59
Neutral

Join Minipip Academy and access free courses in investing, trading, economics, and more.
Sign Up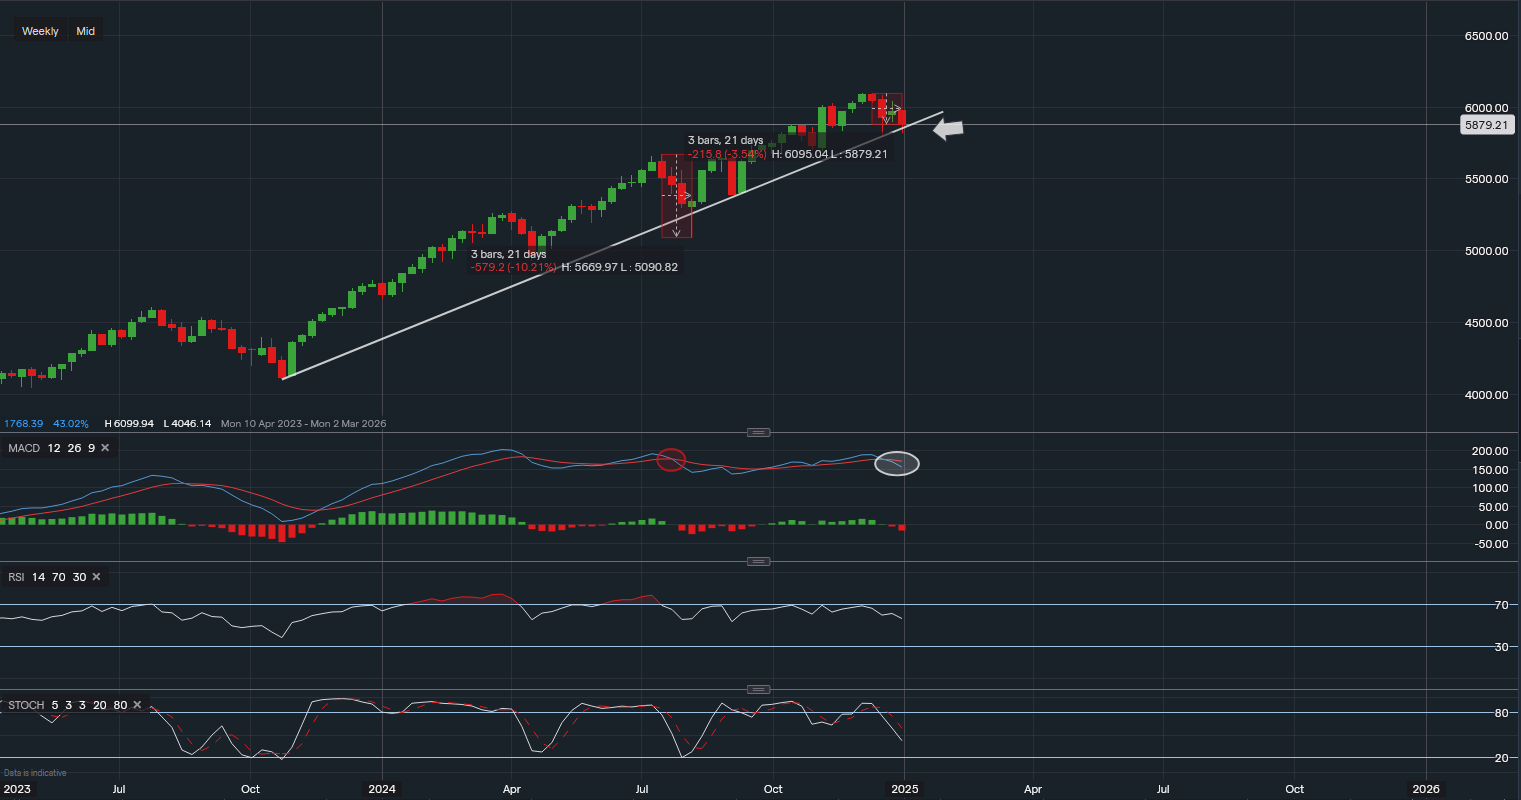
Chart & Data from IG
As the January trading month unfolds, the S&P 500 index is under close scrutiny, with technical indicators hinting at potential near-term weakness. Investors are realigning portfolios, possibly engaging in profit-taking as the market adjusts to a new year under a fresh political landscape.
Currently, the S&P 500 index is trading at approximately 5,879 in the pre-market session, maintaining its position near the ascending trendline established in October 2023. This trendline provides crucial support around 5,843. Notably, yesterday’s session saw the index dip to 5,820 before buyers stepped in to lift the price above this critical level.
The S&P 500 has retraced roughly 3.5% from its December all-time highs. As such, the trendline support around 5,843 will play a pivotal role in determining the index’s trajectory in the coming days and possibly weeks. If this support holds, it could indicate a period of consolidation or even a resumption of the broader uptrend.
A closer look at technical indicators reveals some concerns for the near-term outlook:
MACD: The Moving Average Convergence Divergence (MACD) has recently crossed below its signal line. This bearish crossover mirrors a similar occurrence from July/August 2023, which preceded a 10% decline in the index. While history may not repeat itself exactly, this is a noteworthy signal of potential downward pressure.
RSI and Stochastic Oscillators: Both the Relative Strength Index (RSI) and the Stochastic Oscillator are trending downward, further supporting the case for a possible pause or pullback in the current bull market.
While these indicators point to a cooling period, the extent of any decline is likely to be limited. A drop of 1-2% or a sideways movement over the next few weeks could be more probable than a steep correction.
For the rally to regain momentum, consolidation around the current support level is crucial. If the index stabilises above 5,843, this could rebuild investor confidence. On the upside, a breakout above the resistance level at 6,044 would significantly bolster the bullish case, potentially setting the stage for a renewed advance.
In summary, while technical indicators suggest a cautious near-term outlook for the S&P 500, the market’s ability to hold above key support levels will be critical. Investors should watch for consolidation signals and pay attention to potential catalysts that could influence the index’s direction in the weeks ahead.
For the latest updates and expert analysis on the S&P 500 and other key market trends, stay tuned to our market insights.

Tradable assets:
Min.Deposit:
Max Leverage:
FCA:

Rating:
 Earnings Calendar
  Economic Calendar
  VAT Calculator
  Tax Free Childcare Calculator
 Percentage Calculator
 Compound Interest Calculator
  Loan Overpayment Calculator
 Mortgage Calculator
 Credit Card Calculator
 Investing
  Economics
 Trading
  Technical Analysis
  Personal Finance
 Calculator


