UnitedHealth Group Analysis: Defensive Healthcare Scale Amid Regulatory and Margin Pressures
$407.34
12 Jun 2026, 17:06
Neutral

Join Minipip Academy and access free courses in investing, trading, economics, and more.
Sign Up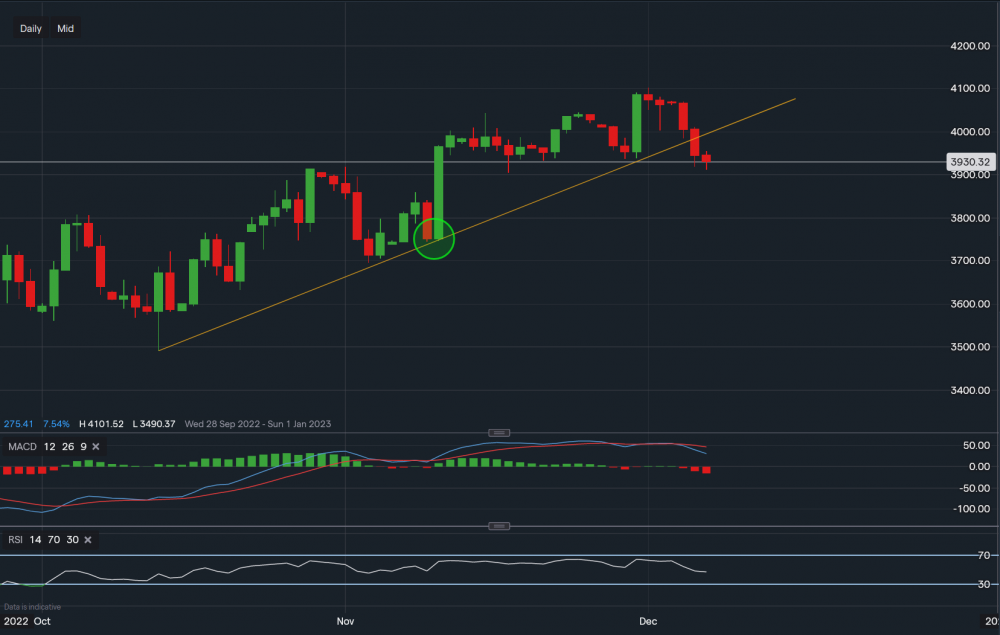
S&P 500 - Chart & Data from IG
From a technical aspect, the S&P 500 is trading at 3930. As shown on the chart it has broken through the support trendline (orange) and now it faces minor support at 3903 then at 3842 then at 3813. A break below these levels could see the index slide further towards a key level at 3743 (green oval). Although, this is more likely in the mid-term. Towards the upside, if support becomes stable, resistance sits at 3974 then at 3986 then at 4010. A break above 4010 may see the index climb back up towards 4100, this is more likely in the short/mid term. Looking at the indicators, MACD is currently negative and RSI is neutral as it reads 46. RSI is slightly faltering.
 Earnings Calendar
  Economic Calendar
  VAT Calculator
  Tax Free Childcare Calculator
 Percentage Calculator
 Compound Interest Calculator
  Loan Overpayment Calculator
 Mortgage Calculator
 Credit Card Calculator
 Investing
  Economics
 Trading
  Technical Analysis
  Personal Finance
 Calculator


