Visa (NYSE:) Technical Analysis: Earnings in Focus as Bullish Momentum Builds
$364.68
28 Jul 2026, 15:59
Neutral

Join Minipip Academy and access free courses in investing, trading, economics, and more.
Sign Up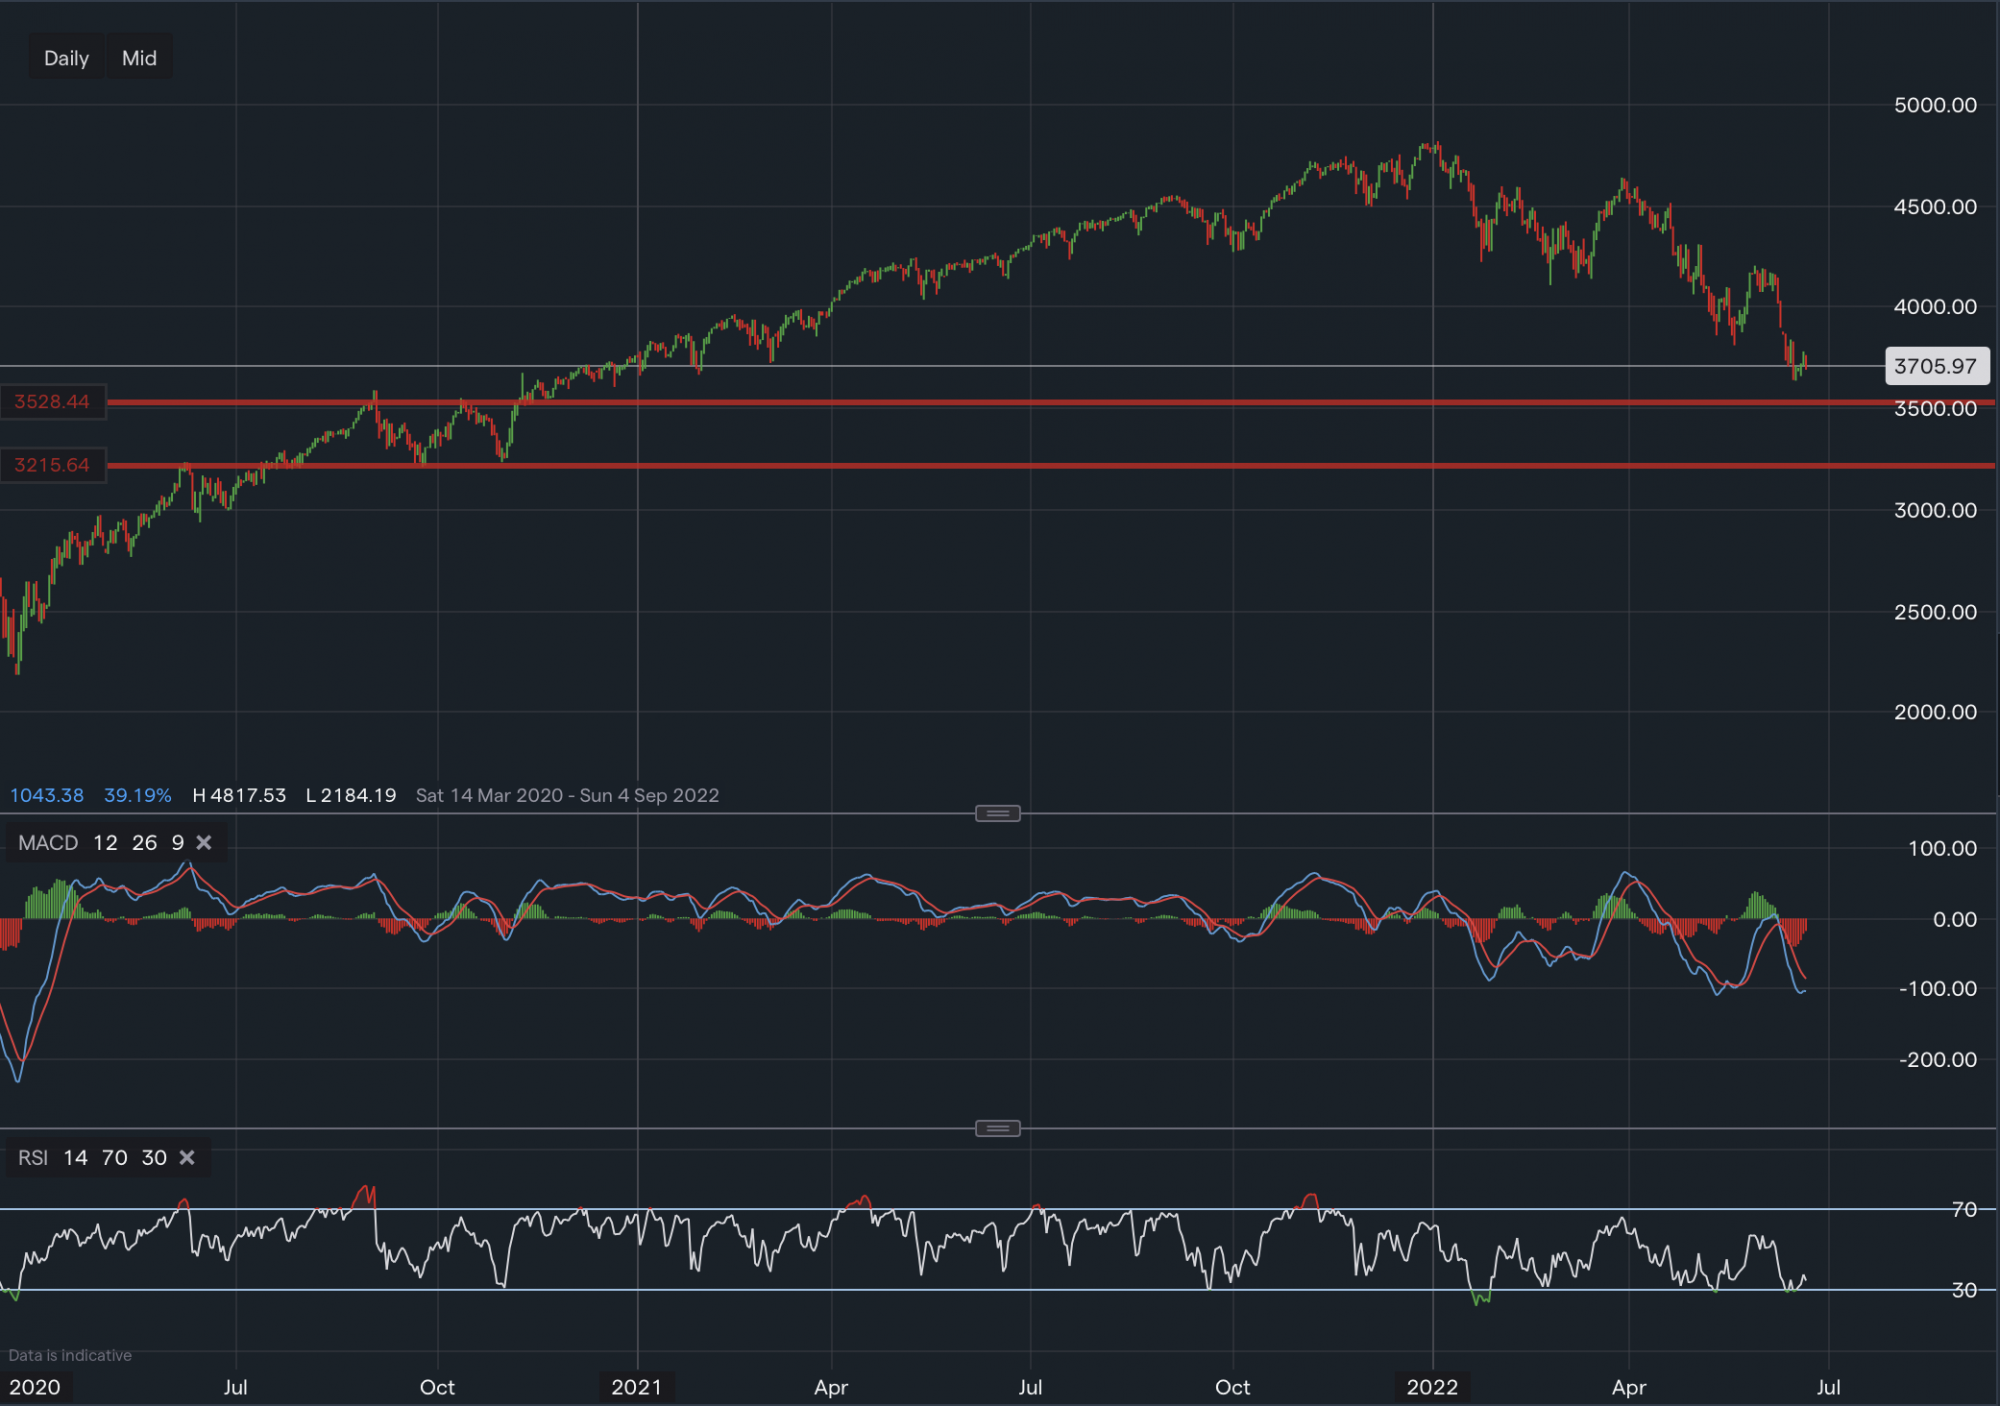
The S&P500 continues to stay under pressure this year as inflation and geopolitical issues continue. The technical chart suggests more downside in the near time. RSI reads 34.5, with MACD firmly negative, showing some possible signs of consolidation. Support for the S&P sits at 3,635, a break below here could take the index towards 3,585 (Sept 2020 peak), followed by 3,215 (2020 double bottom). Towards the upside, the S&P has resistance above at 3,809, followed by the gap up of 3,903. A break above here could take the index towards 4,091 then 4,201.
UK CPI figures were released today at a whopping 9.1%, showing signs that inflation isn’t slowing, this will prompt central banks to likely continue to raise interest rates to get back to the 2% target most economies have. Neither scenario is good for stocks & indices because higher rates make it harder to borrow and inflation just eats into profit margins, which can already be seen in many UK stocks like Boohoo and IAG.
Comment: If we also look at shares like Apple, which dominate index weightings, it has the potential to fall another 15% before it has real horizonal support at the $116 level. And if it did decline to this level, it is still not as big as the 2018 decline which saw apple decline around 38%. However, in the long term it could work out very well and become a great buying opportunity as investors seem to have forgotten about the decline from 2018, that’s how easy it is to forget bear markets, therefore its important to think long term in a market like this as it does bring opportunities.
 Earnings Calendar
  Economic Calendar
  VAT Calculator
  Tax Free Childcare Calculator
 Percentage Calculator
 Compound Interest Calculator
  Loan Overpayment Calculator
 Mortgage Calculator
 Credit Card Calculator
 Investing
  Economics
 Trading
  Technical Analysis
  Personal Finance
 Calculator


