UnitedHealth Group Analysis: Defensive Healthcare Scale Amid Regulatory and Margin Pressures
$407.34
12 Jun 2026, 17:06
Neutral

Join Minipip Academy and access free courses in investing, trading, economics, and more.
Sign Up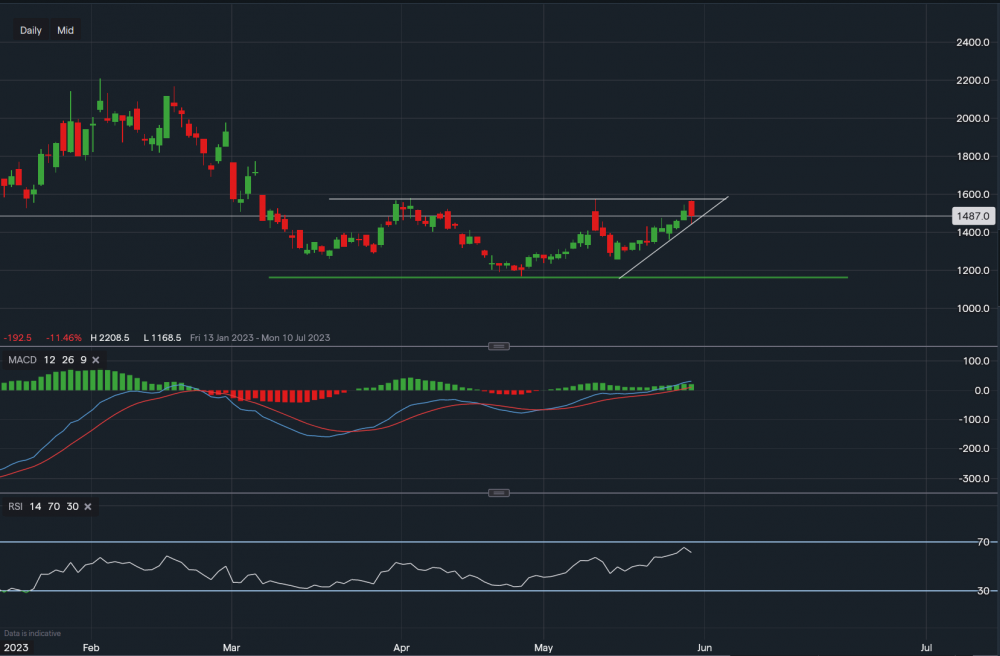
Chart & Data from IG
Taking a look at Rivian as it seems like it has formed a slight base of support. Currently trading at around $14.87 a share with the support base below at $11.68 (green trendline). The price has been in a bullish trend since the 15th of May and is now approaching resistance at $15.72 (upper white trendline). A break above the trendline could see the price edge higher towards $17.73. Towards the downside, support sits at $14.43, which is along the rising white trendline. A break below this point could see the price fall lower towards $13.60 and then $12.55. Looking at the technical indicators, MACD is still positive and so is the RSI as it reads 61. Although, the RSI has retraced slightly after almost entering ‘overbought’ territory.

Tradable assets:
Min.Deposit:
Max Leverage:
FCA:

Rating:
 Earnings Calendar
  Economic Calendar
  VAT Calculator
  Tax Free Childcare Calculator
 Percentage Calculator
 Compound Interest Calculator
  Loan Overpayment Calculator
 Mortgage Calculator
 Credit Card Calculator
 Investing
  Economics
 Trading
  Technical Analysis
  Personal Finance
 Calculator


