Adobe Stock Analysis: Can ADBE Recover Ahead of Earnings?
$251.44
08 Jun 2026, 11:14
Neutral

Join Minipip Academy and access free courses in investing, trading, economics, and more.
Sign Up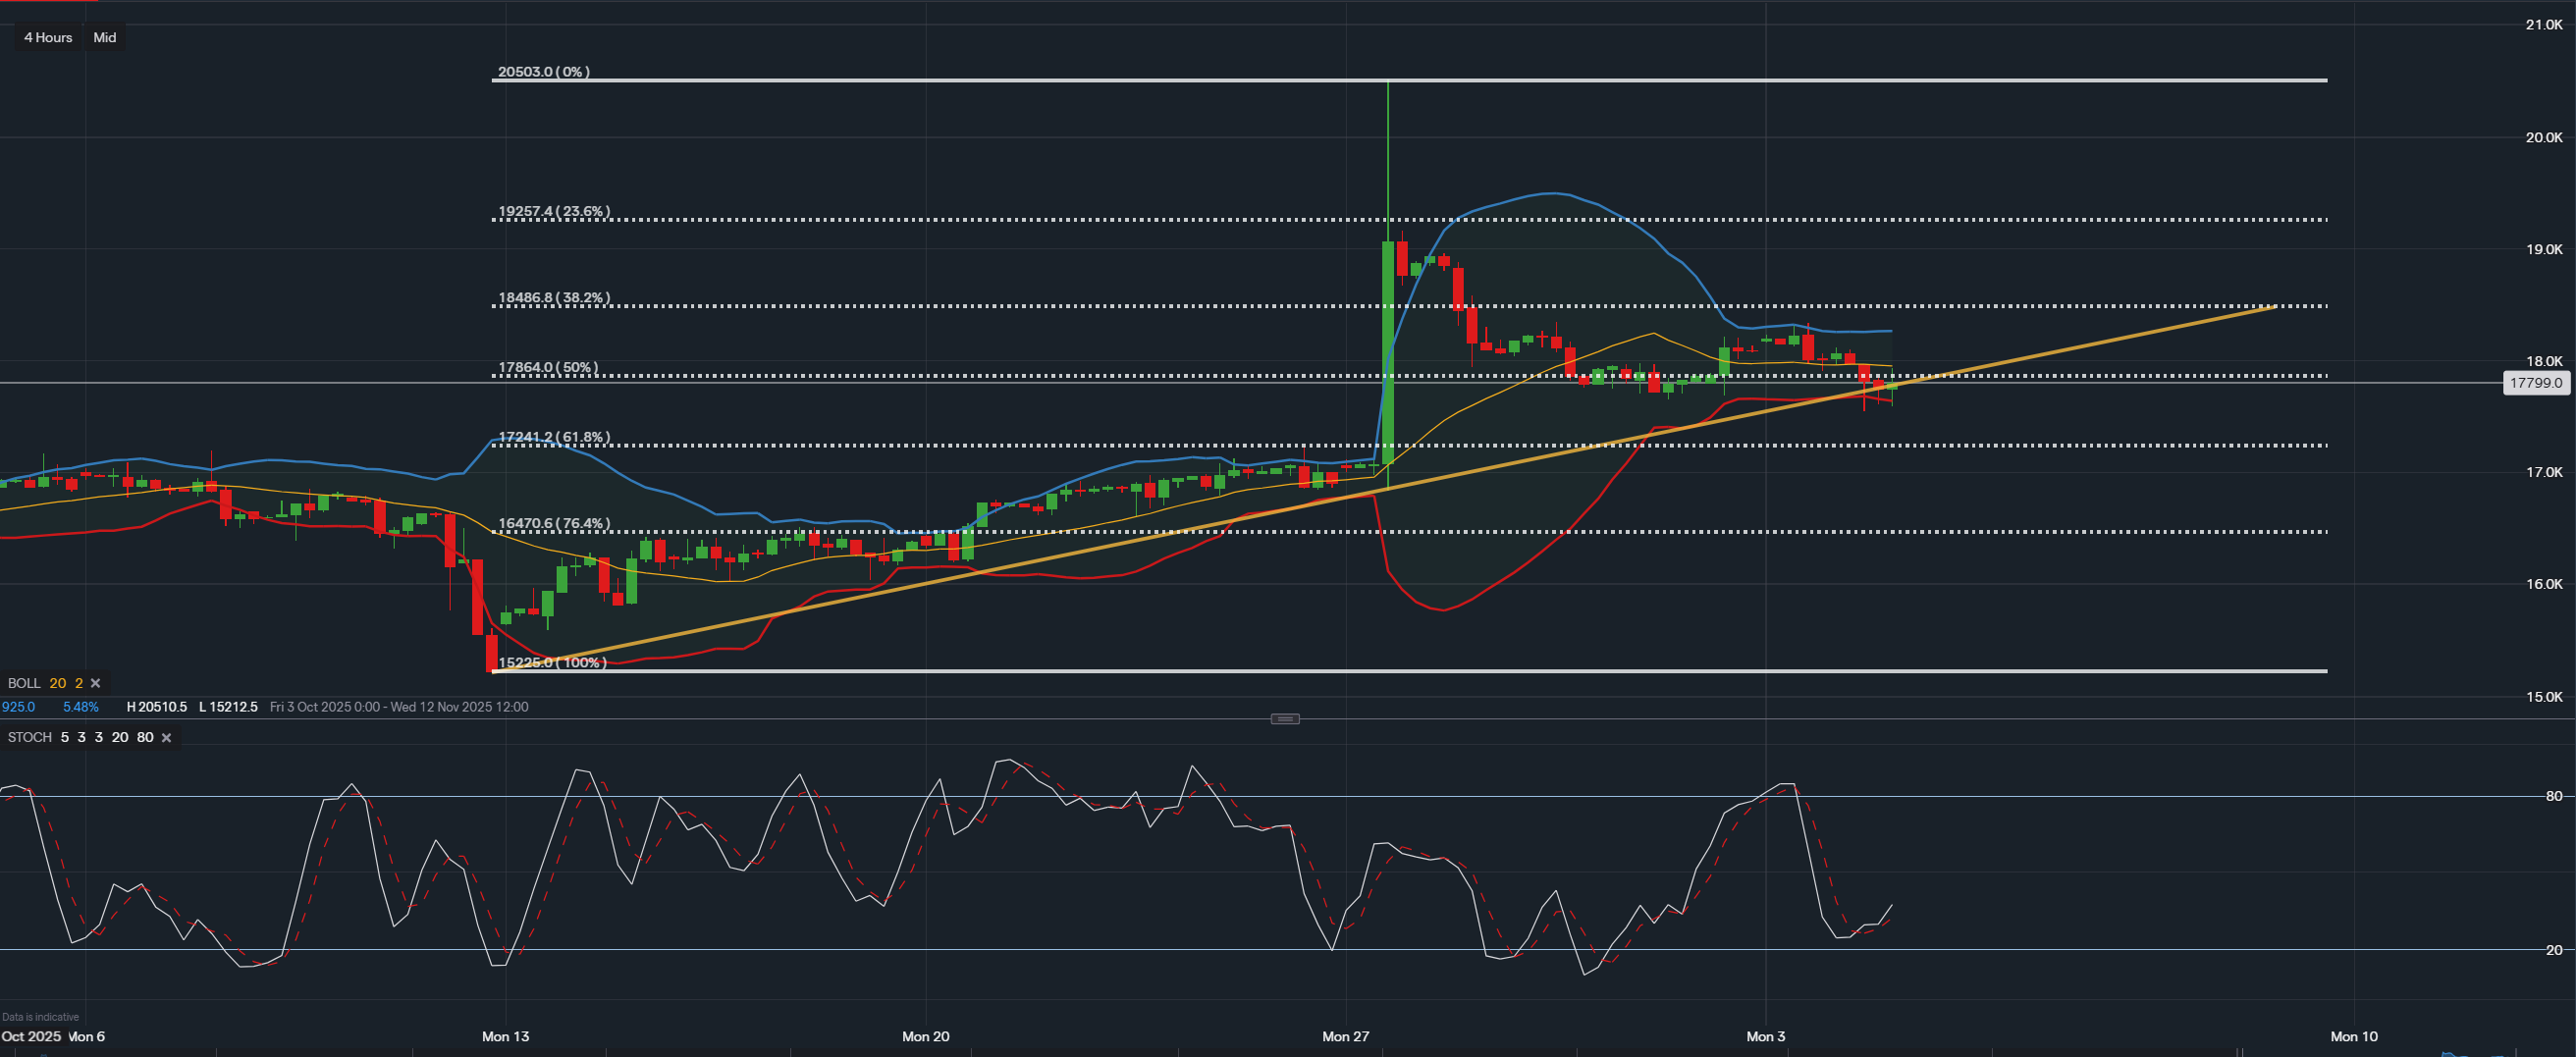
Data from IG - Time fame - 4H
Overview
Qualcomm Inc (NASDAQ: QCOM) currently appears to be positioned around fair value, with a price-to-earnings (P/E) ratio of 17.24 and a forward P/E ratio of 14.59. These figures suggest that the stock could be viewed as reasonably priced relative to its projected earnings. Within the broader semiconductor industry, Qualcomm continues to maintain a strong presence, supported by consistent innovation in wireless communication technologies and mobile chipsets.
Earnings Outlook
The company is due to release its next earnings report on 5 November 2025. In the previous year, earnings per share (EPS) were reported at $2.26, while the current consensus forecast expects EPS to reach $2.33, indicating a potential 3% year-on-year increase.
Over the last twelve months, Qualcomm’s share price has risen by approximately 7%, reflecting improving sentiment within the technology sector. While past performance does not guarantee future results, this trajectory may suggest that the stock has room to adjust as new financial data becomes available.
Analyst Sentiment
According to TipRanks data, coverage of Qualcomm includes ten analysts, seven rating it as “Buy” and three maintaining a “Hold” stance. Although the overall view is constructive, this mix of opinions reflects a cautious tone across the market, influenced by broader economic conditions and industry competition. These perspectives highlight that expectations remain balanced between potential upside and near-term uncertainty.
Technical Outlook
On the four-hour chart, QCOM is trading around $176.94, consolidating along a steady upward trendline. The price currently sits near the 50% Fibonacci retracement level at $178.64, which serves as a key short-term resistance area.
The Bollinger Bands show moderate volatility, with the price moving within a contained range. The Stochastic Oscillator indicates that the %K line has crossed above the %D line, a pattern that may suggest a short-term bullish bias. However, as the indicator approaches the overbought region, there is potential for consolidation before any continuation of upward momentum.
If the price were to move above the $178.64 resistance level, subsequent areas of interest could include $184.87 (38.2% retracement) and $192.57 (23.6% retracement). Alternatively, if the trendline were to break, possible support levels may be found near $172.41 (61.8% retracement) and $164.71 (76.4% retracement).
Summary
As of early November 2025, Qualcomm Inc (QCOM) demonstrates characteristics of a stock that may be consolidating ahead of its earnings announcement. With a fair valuation, modestly improving earnings expectations, and a balanced analyst outlook, the company remains on watch for potential price movement in either direction. The upcoming earnings report could serve as a key catalyst for renewed momentum, depending on whether results align with or exceed current market forecasts.
Disclaimer: This analysis is for informational purposes only and should not be considered financial advice. Investors should conduct their own research before making any investment decisions.

Tradable assets:
Min.Deposit:
Max Leverage:
FCA:

Rating:
 Earnings Calendar
  Economic Calendar
  VAT Calculator
  Tax Free Childcare Calculator
 Percentage Calculator
 Compound Interest Calculator
  Loan Overpayment Calculator
 Mortgage Calculator
 Credit Card Calculator
 Investing
  Economics
 Trading
  Technical Analysis
  Personal Finance
 Calculator