UnitedHealth Group Analysis: Defensive Healthcare Scale Amid Regulatory and Margin Pressures
$407.34
12 Jun 2026, 17:06
Neutral

Join Minipip Academy and access free courses in investing, trading, economics, and more.
Sign Up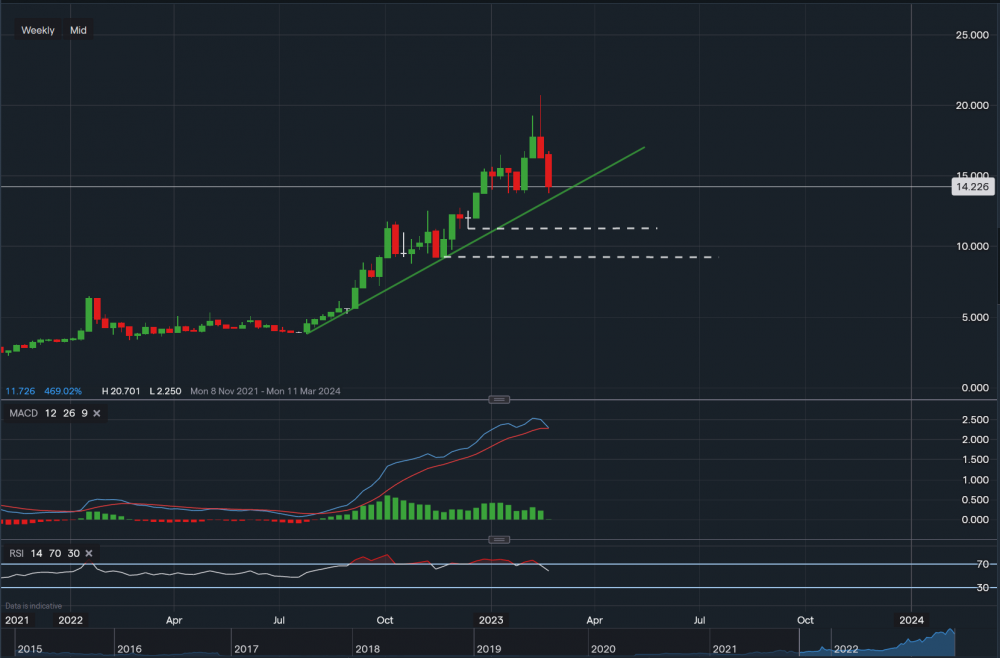
Prospex Energy - Chart & Data from IG
Overview
Prospex Energy Plc is an oil and gas investment firm established in the United Kingdom. The firm is developing an investment portfolio with a focus on late-stage onshore European potential for the production of gas and electricity.
Financials
The company recorded total assets of £8.98m for the fiscal year that concluded on December 31, 2021, compared to £5.75m in 2020. The revaluation reflecting precise recognition of advantageous changes in the forward curve of European gas prices, as well as repayments and advances on loans receivable from investments, account for the majority of the 56% gain. Unrealised gains totalled £3.07m (unrealised loss: £1.12m for 2020). Due to management's efforts to lower the company's cost base, administrative costs for the entire year came to £891,676, an 8% decrease from 2020's £972,193. The firm has cash and cash equivalents of £220,060 as of December 31, 2021, up from £220,618 in 2020. Moreover, in contrast to a loss of £1,806,492 in 2020, continuing operations generated a net profit of £2,259,796. Finally, By issuing 70,137,143 additional 0.1p ordinary shares at a price of 3.50 pence each in February 2022, the firm was able to raise £2.455 million (before expenses). The company's stake in the Selva Field in Italy has increased from 17% to 37% as a result of the completion of the acquisition of 20% of the field (selva is the onshore gas field in northern Italy).
Technicals
From a technical outlook, Prospex’s shares are currently trading at around 14.22p a share. We can see that from the 25th of July, 2022, the trend has been bullish (positive) with support along the trendline (green). At present on the weekly timeframe, the first support level sits at 13.75p, a break and close below this level could see a test of support at 11.25p (upper dotted trendline) followed by 9.25p (lower dotted trendline). On the other hand, if the pattern continues, resistance sits at 15.62p then at 16.50p then at 19.25. A break above 19.25 may see the price climb back up to 20.70 (last seen in the week beginning 13th of February, 2023). Looking at the technical indicators, MACD is heading towards a negative stance but RSI is positive as it reads 59, although faltering. RSI may be faltering because it suggested that the stock was ‘overbought’ for a period of time. Hence, this could be a short-term dip before a potential bounce higher.
 Earnings Calendar
  Economic Calendar
  VAT Calculator
  Tax Free Childcare Calculator
 Percentage Calculator
 Compound Interest Calculator
  Loan Overpayment Calculator
 Mortgage Calculator
 Credit Card Calculator
 Investing
  Economics
 Trading
  Technical Analysis
  Personal Finance
 Calculator


