Visa (NYSE:) Technical Analysis: Earnings in Focus as Bullish Momentum Builds
$364.68
28 Jul 2026, 15:59
Neutral

Join Minipip Academy and access free courses in investing, trading, economics, and more.
Sign Up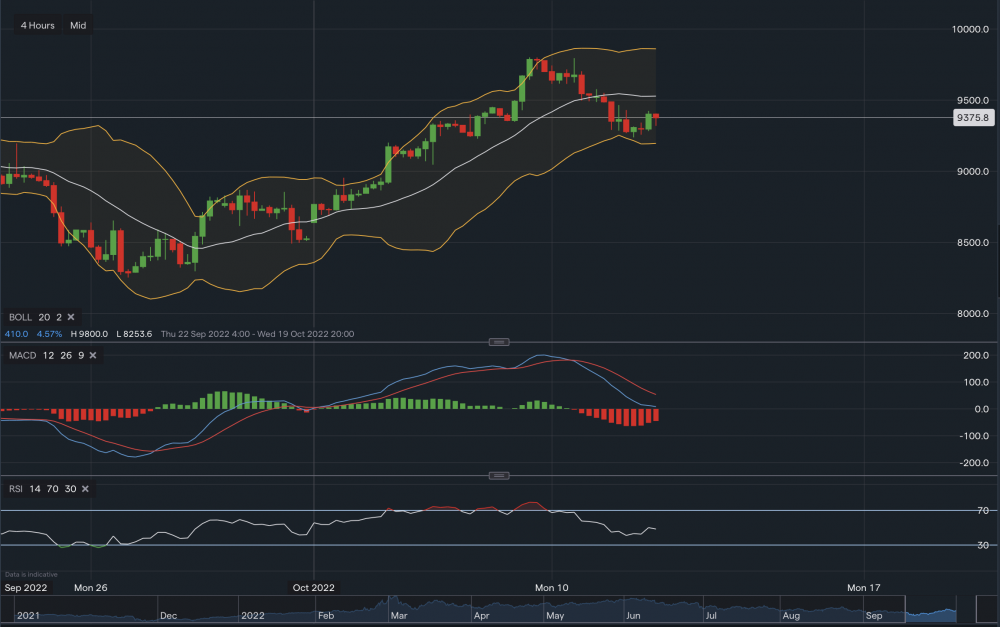
US inflation data is coming up this week which could have an influence on either direction for oil. From a technical perspective, the price of brent crude oil is currently sitting at $93.75. With the utilisation of the Bollinger bands, support sits at $92.38. A break below this support level could see the oil price drop further towards the next support level at $91.95, which corresponds with the lower Bollinger band. Towards the upside the first resistance level rests at $94.65, followed by this is further resistance at $95.27 (middle moving average of the Bollinger bands). A break above the middle moving average may see the oil price hike towards the $97 price tag. Taking a look at the other indicators, MACD is currently negative but RSI reads 48 suggesting a neutral position.
 Earnings Calendar
  Economic Calendar
  VAT Calculator
  Tax Free Childcare Calculator
 Percentage Calculator
 Compound Interest Calculator
  Loan Overpayment Calculator
 Mortgage Calculator
 Credit Card Calculator
 Investing
  Economics
 Trading
  Technical Analysis
  Personal Finance
 Calculator


