UnitedHealth Group Analysis: Defensive Healthcare Scale Amid Regulatory and Margin Pressures
$407.34
12 Jun 2026, 17:06
Neutral

Join Minipip Academy and access free courses in investing, trading, economics, and more.
Sign Up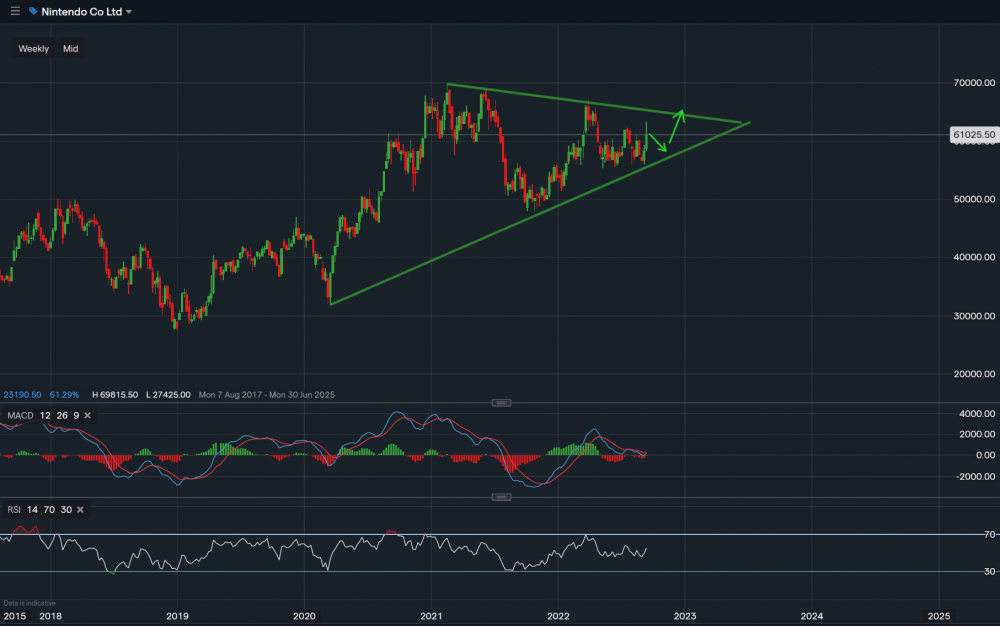
From a technical aspect, the stock price is at Ұ61,025 (£373.76) and it is in a bullish position. The resistance level sits at Ұ64,632 (£395.76) which is the upper green trendline in the ascending triangle. A break above this could see the stock climb in the direction of Ұ69,085 (£423.03). Towards the downside, an established level of support sits at Ұ55,950 (£342.60), which is the lower green trendline of ascending triangle. A break below this could see the stock slide further towards the next support level of Ұ51,455 (£315.07). Looking at the indicators, MACD is showing a neutral stance and RSI reads 55 suggesting neutral but on the verge of being positive. Overall, this share is bullish and one to keep an eye on, as a bounce higher could occur if the support level holds.
 Earnings Calendar
  Economic Calendar
  VAT Calculator
  Tax Free Childcare Calculator
 Percentage Calculator
 Compound Interest Calculator
  Loan Overpayment Calculator
 Mortgage Calculator
 Credit Card Calculator
 Investing
  Economics
 Trading
  Technical Analysis
  Personal Finance
 Calculator


