Visa (NYSE:) Technical Analysis: Earnings in Focus as Bullish Momentum Builds
$364.68
28 Jul 2026, 15:59
Neutral

Join Minipip Academy and access free courses in investing, trading, economics, and more.
Sign Up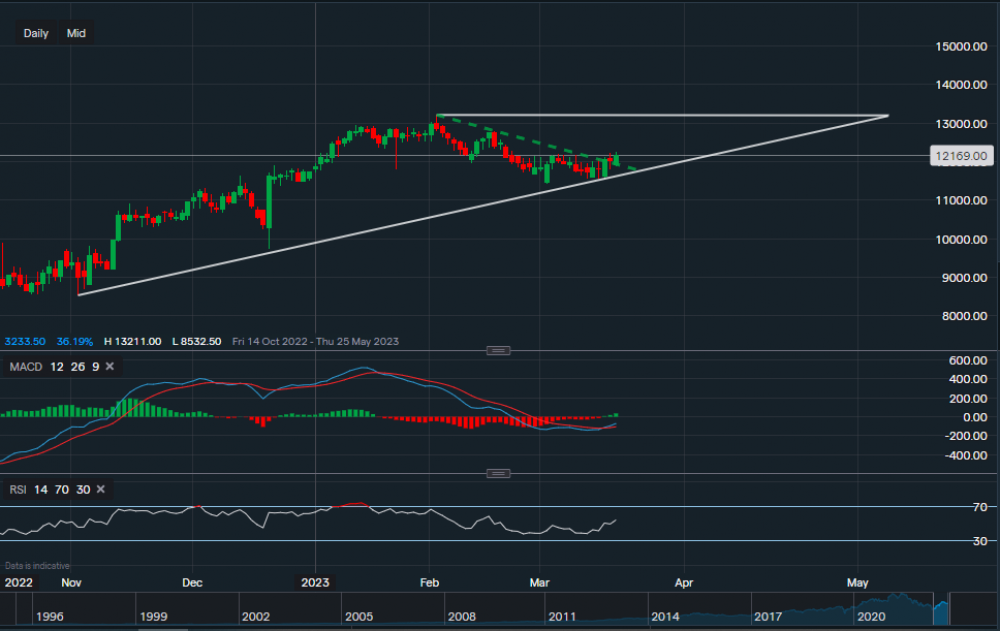
Chart & Data from IG
Nike’s stock is currently trading at around $121.69 a share. We can see a continuation of the bullish trend dating back to 2nd of November last year. There was a retracement in the month of February, but the price consolidated in early March and support along the ascending trendline held out firmly (white ascending trendline). Support sits at $115.51, which is right on the trendline with further support just below it at $114.35. A break below $114.35 could lead to a big sell-off and see the price decline to around $100. However, as we can see a break above the descending dotted trendline has occurred, the bias remains bullish. Resistance now sits at $127.95 then at $132.11, which is highlighted by the horizontal white trendline. A break above this price level may see the price climb towards $140 a share. Looking at the technical indicators, MACD on the daily timeframe has turned positive and RSI is neutral but heading towards positive as it reads 53.
 Earnings Calendar
  Economic Calendar
  VAT Calculator
  Tax Free Childcare Calculator
 Percentage Calculator
 Compound Interest Calculator
  Loan Overpayment Calculator
 Mortgage Calculator
 Credit Card Calculator
 Investing
  Economics
 Trading
  Technical Analysis
  Personal Finance
 Calculator


