UnitedHealth Group Analysis: Defensive Healthcare Scale Amid Regulatory and Margin Pressures
$407.34
12 Jun 2026, 17:06
Neutral

Join Minipip Academy and access free courses in investing, trading, economics, and more.
Sign Up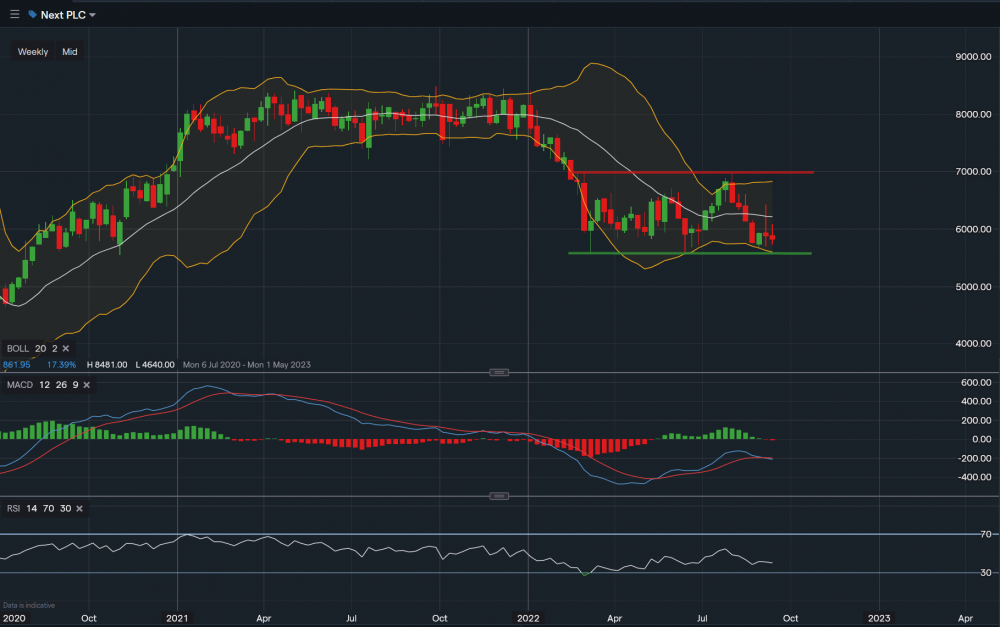
From a technical overview, towards the downside the first level of support sits at £5.65. This is also where the bottom Bollinger band is located. A slip below this level could see the share test the next major support at £5.57 (green trendline). As consumer spending has decreased due to the rise of inflation, the upcoming months will be vital for this support level to hold. In relation to the upside, the level of resistance sits at £6.21 which is where the SMA of the Bollinger band meets (white line). A break above this SMA level could test the next level of resistance at £6.42. RSI reads 40 (negative) and MACD neutral, suggesting the possibility of a further downtrend remains. However, this is very dependent on the outcome of economy in the short/mid-term.
 Earnings Calendar
  Economic Calendar
  VAT Calculator
  Tax Free Childcare Calculator
 Percentage Calculator
 Compound Interest Calculator
  Loan Overpayment Calculator
 Mortgage Calculator
 Credit Card Calculator
 Investing
  Economics
 Trading
  Technical Analysis
  Personal Finance
 Calculator


