Visa (NYSE:) Technical Analysis: Earnings in Focus as Bullish Momentum Builds
$364.68
28 Jul 2026, 15:59
Neutral

Join Minipip Academy and access free courses in investing, trading, economics, and more.
Sign Up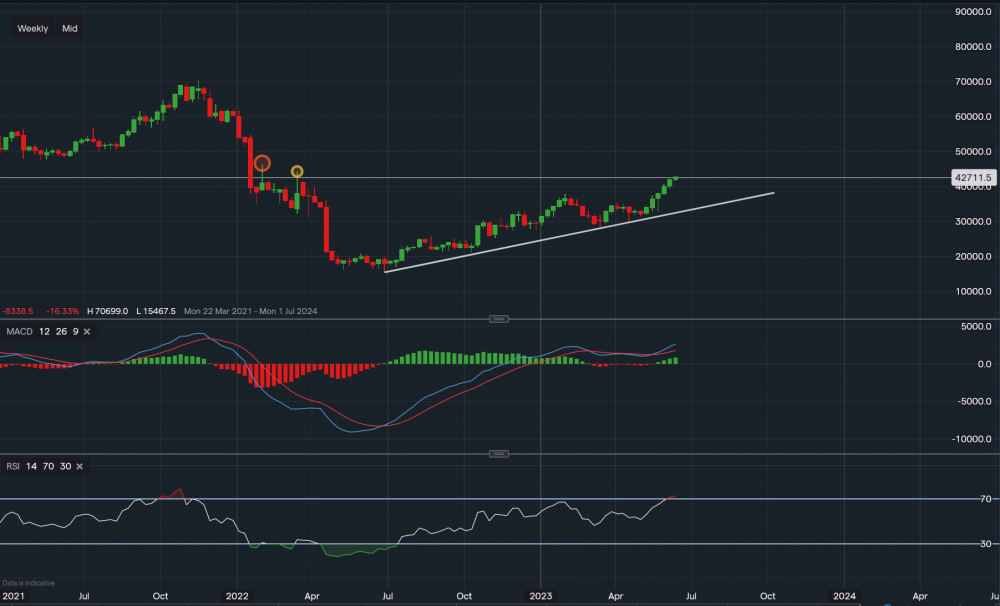
Chart & Data from IG
Since the 27th of June 2022, Netflix's shares have risen 176% YTD. They have risen almost 17% over the last 3 weeks alone, partly on the news regarding the password-sharing crackdown which has boosted its price and attracted investors. The streaming giant’s shares crashed 74% in 2022 when it reported its first-ever decline in subscribers, but it is now demonstrating a gradual comeback. Currently, its shares are trading at around $427.11 a share. Looking at the weekly timeframe, support is well established below along the trendline, with the key support sitting at $349.20. Only a dip below this level could see the price move lower towards $295.08 and potentially even $285.30. However, at this moment in time, this is unlikely. As the bias remains bullish, towards the upside we can see that the price faces resistance levels at $443.34 (yellow oval) followed by $463.49 (orange oval). A break and close above the orange oval may see the price rise higher, with the target then between $490-$500. Though this is more likely in the longer term. Looking at the technical indicators, MACD has turned positive and volume is increasing. RSI is also positive as it reads 72. Although, RSI has now entered ‘overbought’ territory.

Tradable assets:
Min.Deposit:
Max Leverage:
FCA:

Rating:
 Earnings Calendar
  Economic Calendar
  VAT Calculator
  Tax Free Childcare Calculator
 Percentage Calculator
 Compound Interest Calculator
  Loan Overpayment Calculator
 Mortgage Calculator
 Credit Card Calculator
 Investing
  Economics
 Trading
  Technical Analysis
  Personal Finance
 Calculator


