UnitedHealth Group Analysis: Defensive Healthcare Scale Amid Regulatory and Margin Pressures
$407.34
12 Jun 2026, 17:06
Neutral

Join Minipip Academy and access free courses in investing, trading, economics, and more.
Sign Up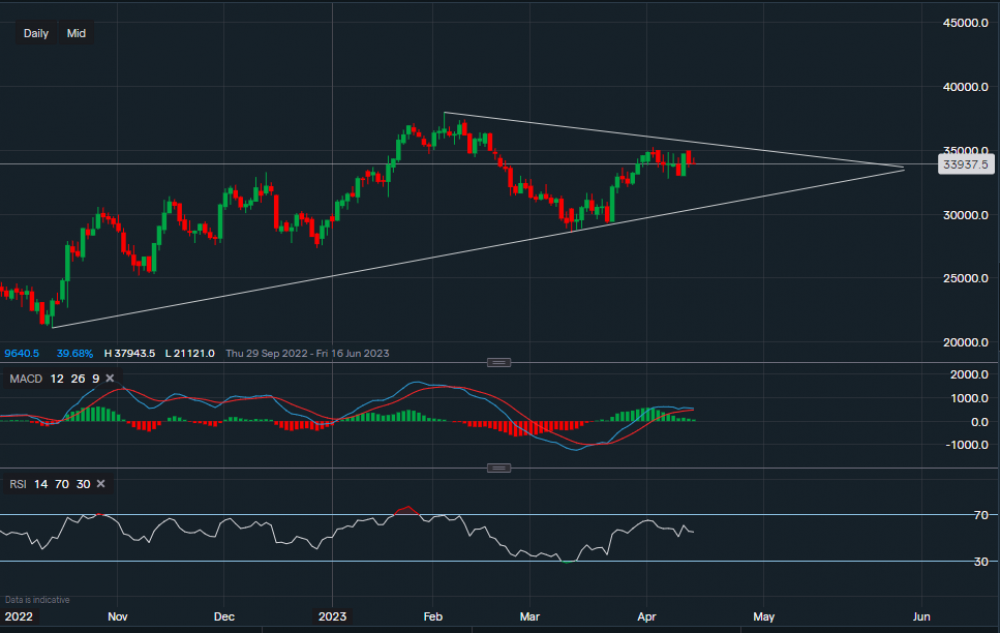
Chart & Data from IG
With the earnings season unravelling this week, in this instance we’re taking a look at Netflix’s stock. Its stock is trading at around $339.37 a share, with first two lines of support sitting at $330.02 followed by $327.86. A break below $327.86 may see its price decline further towards the key support level sitting at $309.28 (along the ascending trendline). A dip below the trendline could be taken as an indication that a reversal trend is taking place, and the likelihood of additional moves lower would increase. On the other hand, towards the upside, resistance currently sits at $349.24 followed by $352.29 (along the descending trendline of the triangle. A break upwards out of the triangle could see the price rise higher towards $360-$370. Looking at the technical indicators, MACD is turning positive prior to the release of the company’s earnings and RSI has just turned neutral from positive as it reads 54 now. Netflix is expected to release earnings tomorrow of $2.86 on revenue of $8.17bn.
 Earnings Calendar
  Economic Calendar
  VAT Calculator
  Tax Free Childcare Calculator
 Percentage Calculator
 Compound Interest Calculator
  Loan Overpayment Calculator
 Mortgage Calculator
 Credit Card Calculator
 Investing
  Economics
 Trading
  Technical Analysis
  Personal Finance
 Calculator


