Visa (NYSE:) Technical Analysis: Earnings in Focus as Bullish Momentum Builds
$364.68
28 Jul 2026, 15:59
Neutral

Join Minipip Academy and access free courses in investing, trading, economics, and more.
Sign Up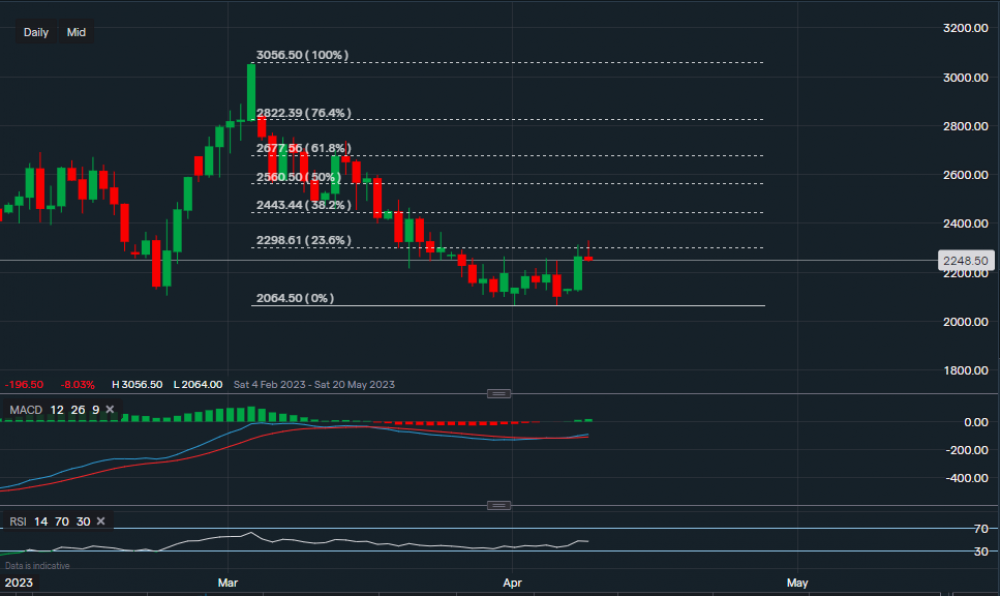
Chart & Data from IG
After the extreme sell-off and downside pressure since Christmas, natural gas is now trading at around $2.248. Applying the Fibonacci retracement to the chart, perhaps the beaten down commodity has found a base at $20.64. A break below this support base could see the price decline to as low as $1.600. Although, traders are keeping an eye on the market for a potential comeback due to higher demand in Asian markets and China’s LNG purchases since loosening Covid restrictions. The resistance is sitting at $2.298 (23.6% fib), it is a tough resistance point to overcome but yesterday’s impulsive candlestick may have sparked some positivity. A break above the 23.6% fib would see resistance levels at $2.443 (38.2% fib) followed by $2.560 (50% fib). April could be a key month for gas to determine its mid-term outlook. Looking at the technical indicators, MACD has turned positive and RSI is neutral as it reads 45.
 Earnings Calendar
  Economic Calendar
  VAT Calculator
  Tax Free Childcare Calculator
 Percentage Calculator
 Compound Interest Calculator
  Loan Overpayment Calculator
 Mortgage Calculator
 Credit Card Calculator
 Investing
  Economics
 Trading
  Technical Analysis
  Personal Finance
 Calculator


