UnitedHealth Group Analysis: Defensive Healthcare Scale Amid Regulatory and Margin Pressures
$407.34
12 Jun 2026, 17:06
Neutral

Join Minipip Academy and access free courses in investing, trading, economics, and more.
Sign Up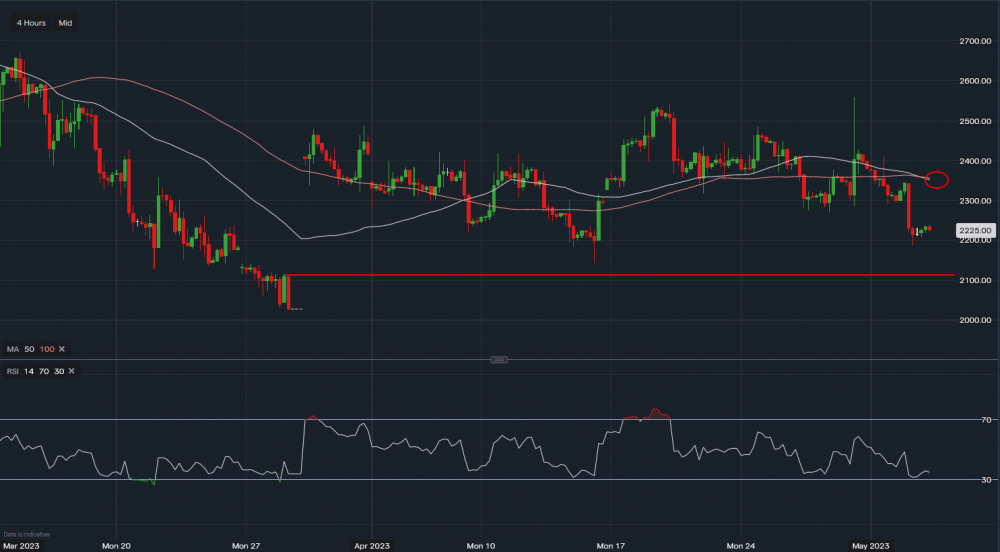
Natural gas - Chart & Data from IG
Natural Gas has given back most of last week's 13% rise and could fill the March gap. Since this gap higher natural gas prices have been stuck in a range of $2.198 to $2.534 and for traders this has provided some good swing trading opportunities. Right now Gas is around 30pts off the low of this range, however, if the market breaks this level at $2.198. Gas could easily fall to $2.100 and then $2.000 and it could do that within a matter of hours, hence this being a 'risk on' market right now. Another negative flashing indication on that the 50 & 100 SMAs have crossed over which over the past month has not happened therefore tilting the bias slightly bearish from a technical point. The range does still hold though and Natural gas could bounce higher toward the moving average as there is a divergence of nearly 6% between the moving averages and the actual price, therefore a bounce higher to meet the moving average could be possible and could provide a good trade opportunity. In previous attempts of gas moving such distance from the moving average, it has eventually either fallen or risen to match the averages which currently read $2.350.
 Earnings Calendar
  Economic Calendar
  VAT Calculator
  Tax Free Childcare Calculator
 Percentage Calculator
 Compound Interest Calculator
  Loan Overpayment Calculator
 Mortgage Calculator
 Credit Card Calculator
 Investing
  Economics
 Trading
  Technical Analysis
  Personal Finance
 Calculator


