Visa (NYSE:) Technical Analysis: Earnings in Focus as Bullish Momentum Builds
$364.68
28 Jul 2026, 15:59
Neutral

Join Minipip Academy and access free courses in investing, trading, economics, and more.
Sign Up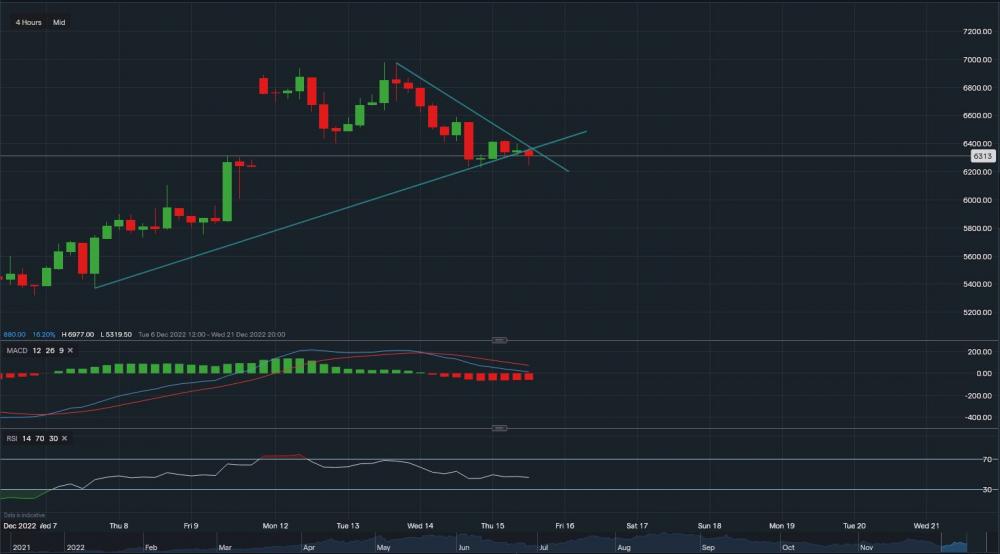
Natural Gas - Chart & Data from IG
From a technical perspective, gas is currently trading at around €63.13. On the 4-hourly timeframe, it has broken through the lower support trendline of the triangle as shown on the graph. Further support sits at €62.30. A break below €62.30 could see the price of gas slide towards the low €60's. However, with the winter season approaching and weather temperatures already dropping below 0 degrees Celsius, consumers will be using more energy than usual. Hence, demand will increase. Britain is forecasted to see the highest daily residential gas demand since January 8th 2021 at 281 million cubic metres per day. Therefore, towards the upside, resistance sits at €63.99 and then at €64.15, A break above these price levels may see the price hike towards the €65-66 price range. Looking at the technical indicators, MACD is currently negative but RSI is neutral as it reads 45.
 Earnings Calendar
  Economic Calendar
  VAT Calculator
  Tax Free Childcare Calculator
 Percentage Calculator
 Compound Interest Calculator
  Loan Overpayment Calculator
 Mortgage Calculator
 Credit Card Calculator
 Investing
  Economics
 Trading
  Technical Analysis
  Personal Finance
 Calculator


