Visa (NYSE:) Technical Analysis: Earnings in Focus as Bullish Momentum Builds
$364.68
28 Jul 2026, 15:59
Neutral

Join Minipip Academy and access free courses in investing, trading, economics, and more.
Sign Up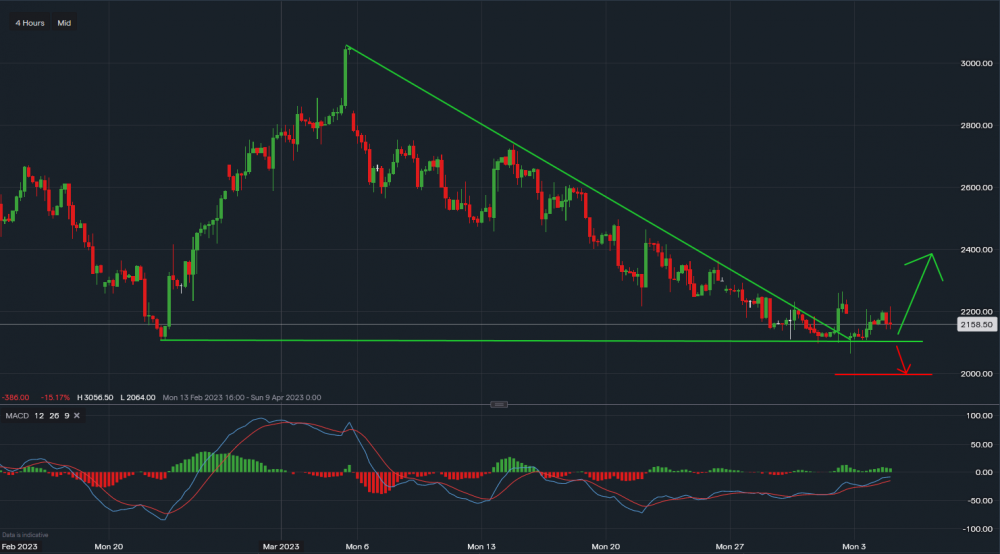
Natural gas - Chart & Data from IG
Natural gas continues to consolidate within the $2.10 - $2.20 range for the moment. A breakdown below the green support line could see Natural gas fall to the red support at $2.00. A break here could see gas then aim for its all-time low of $1.50. It is worth noting that RSI isn't oversold yet on the daily, weekly or monthly timeframe so another drop before the upside is possible. Relative to all other commodities however natural gas is incredibly oversold and sitting at near-all-time lows. Towards the upside, initial resistance for gas sits at $2.242 followed by $2.346. If natural gas does break towards the upside, the main resistance is at $2.842 to $3.053 gap fill dating back to early March. This could provide a good risk to reward for traders. This is a highly sensitive risk-on asset though and risk management is important here.
 Earnings Calendar
  Economic Calendar
  VAT Calculator
  Tax Free Childcare Calculator
 Percentage Calculator
 Compound Interest Calculator
  Loan Overpayment Calculator
 Mortgage Calculator
 Credit Card Calculator
 Investing
  Economics
 Trading
  Technical Analysis
  Personal Finance
 Calculator


