UnitedHealth Group Analysis: Defensive Healthcare Scale Amid Regulatory and Margin Pressures
$407.34
12 Jun 2026, 17:06
Neutral

Join Minipip Academy and access free courses in investing, trading, economics, and more.
Sign Up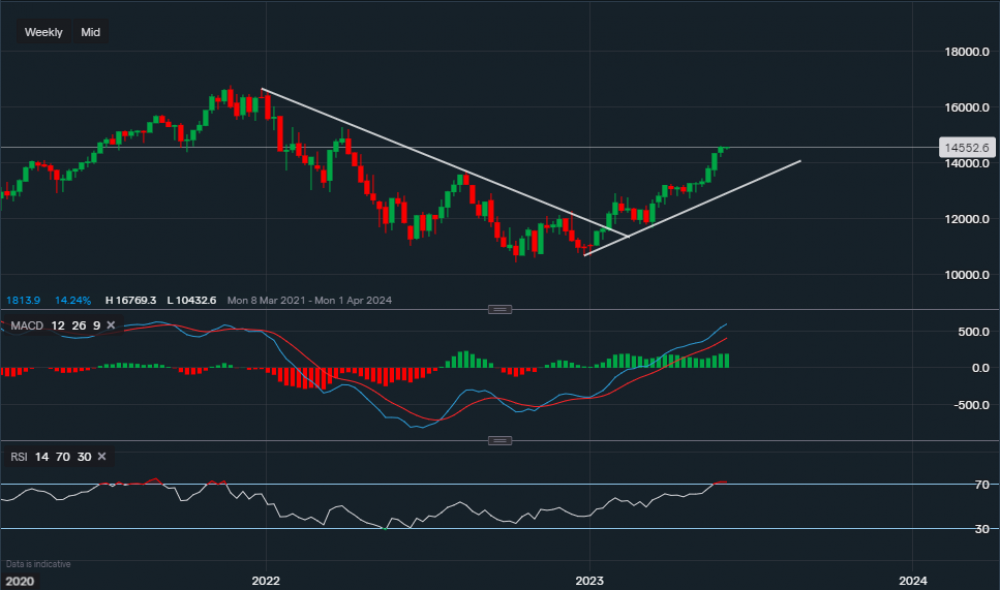
Chart & Data from IG
Nasdaq is up over 30% year-to-date and currently trading at around 14,552. We can now comfortably analyse and comment that the index has left the bearish trend of last year and entered the bullish path at this moment in time. Support below sits at 14,208 then at 13,720 and then at 13,333 (along the ascending trendline). A dip below the trendline could see the index slide further losing its recent gains, in that scenario, the next point of support can then be found at 12,720. However, as the bias remains bullish, towards the upside the next level of resistance sits at 14,653 and then at 15,275. 15,275 will be a tough resistance point to overcome, a break above it may see the index edge higher towards 15,600-15,700. Looking at the technical indicators, the MACD is strongly positive and so is the RSI as it reads 72. Although, the RSI is suggesting that the index is ‘overbought’, therefore, a retracement might occur.

Tradable assets:
Min.Deposit:
Max Leverage:
FCA:

Rating:
 Earnings Calendar
  Economic Calendar
  VAT Calculator
  Tax Free Childcare Calculator
 Percentage Calculator
 Compound Interest Calculator
  Loan Overpayment Calculator
 Mortgage Calculator
 Credit Card Calculator
 Investing
  Economics
 Trading
  Technical Analysis
  Personal Finance
 Calculator


