Visa (NYSE:) Technical Analysis: Earnings in Focus as Bullish Momentum Builds
$364.68
28 Jul 2026, 15:59
Neutral

Join Minipip Academy and access free courses in investing, trading, economics, and more.
Sign Up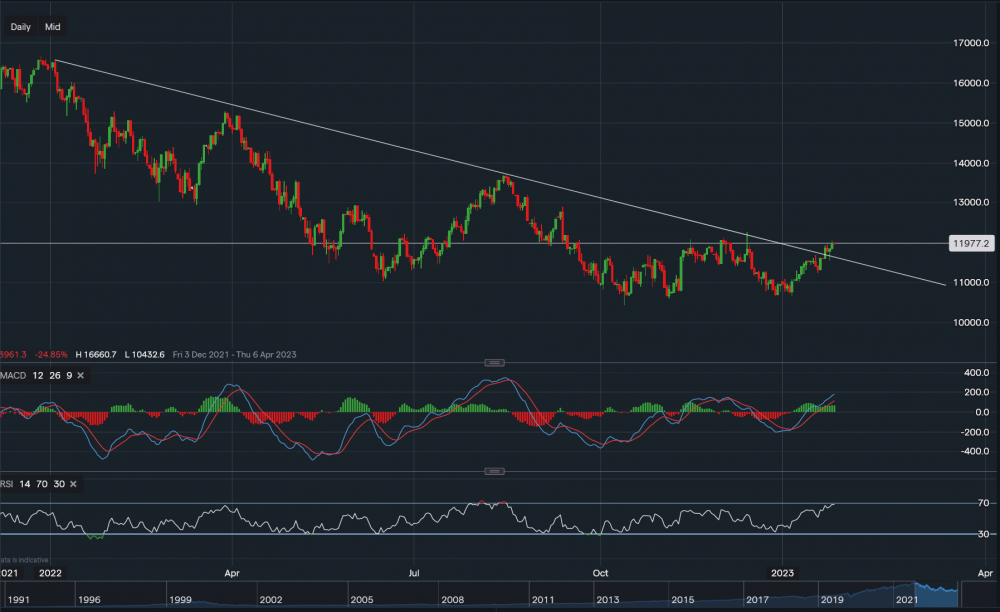
Nasdaq - Chart & Data from IG
Technicals
From a technical outlook, the Nasdaq is currently trading at around 11,977. Taking a look at the chart on the daily timeframe, we can see that the index has broken above crucial resistance, suggesting an upward shift in sentiment. Therefore, the next resistance levels sit at 12,056 then at 12,084 then at 12,117. A break above these levels could see the index climb towards the key resistance located at 12,258. However, next week will be a huge market test for the Nasdaq as the Big Tech companies are expected to report their quarterly earnings. The likes of Meta, Apple, Alphabet and Amazon are all due to report, and negative reports may wipe out the recent market gains and optimism. Therefore, at present, minor support levels sit at 11,923 then at 11,820 then at 11,760. A break below 11,760 could see the index fall towards 11,500-11,600. Looking at the technical indicators, MACD is strongly positive and so is RSI as it reads 67. RSI is floating just below ‘overbought’ territory.
 Earnings Calendar
  Economic Calendar
  VAT Calculator
  Tax Free Childcare Calculator
 Percentage Calculator
 Compound Interest Calculator
  Loan Overpayment Calculator
 Mortgage Calculator
 Credit Card Calculator
 Investing
  Economics
 Trading
  Technical Analysis
  Personal Finance
 Calculator


