UnitedHealth Group Analysis: Defensive Healthcare Scale Amid Regulatory and Margin Pressures
$407.34
12 Jun 2026, 17:06
Neutral

Join Minipip Academy and access free courses in investing, trading, economics, and more.
Sign Up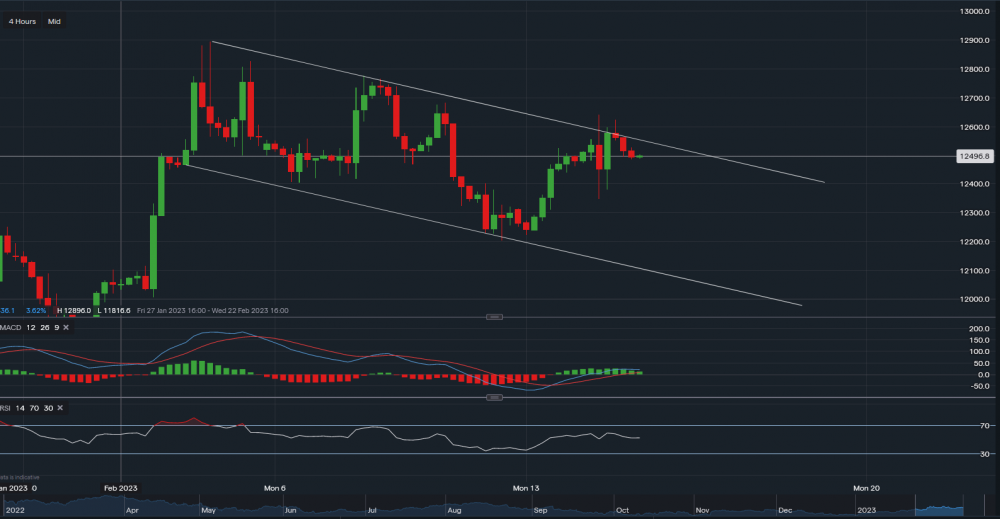
Nasdaq - Chart & Data from IG
The Nasdaq is currently trading at around 12,496. Yesterday the mixed inflation data caused a slight wobble, we can see that the index tried to break out of the short-term bearish trend but failed to close above the upper trendline of the channel (12,580). As of now, resistance levels sit at 12,525 then at 12,555. A break and close above 12,555 may lead to the continuation of the bullish trend, rising towards 12,700-12,800. However, as the present outlook is neutral, support below sits at 12,486 then at 12,462 then at 12,440. A dip below these levels could see the index decline towards the key level sat at 12,348. Looking at the technical indicators, MACD is positive but swaying towards a neutral position and RSI is neutral as it reads 52.
 Earnings Calendar
  Economic Calendar
  VAT Calculator
  Tax Free Childcare Calculator
 Percentage Calculator
 Compound Interest Calculator
  Loan Overpayment Calculator
 Mortgage Calculator
 Credit Card Calculator
 Investing
  Economics
 Trading
  Technical Analysis
  Personal Finance
 Calculator


