Visa (NYSE:) Technical Analysis: Earnings in Focus as Bullish Momentum Builds
$364.68
28 Jul 2026, 15:59
Neutral

Join Minipip Academy and access free courses in investing, trading, economics, and more.
Sign Up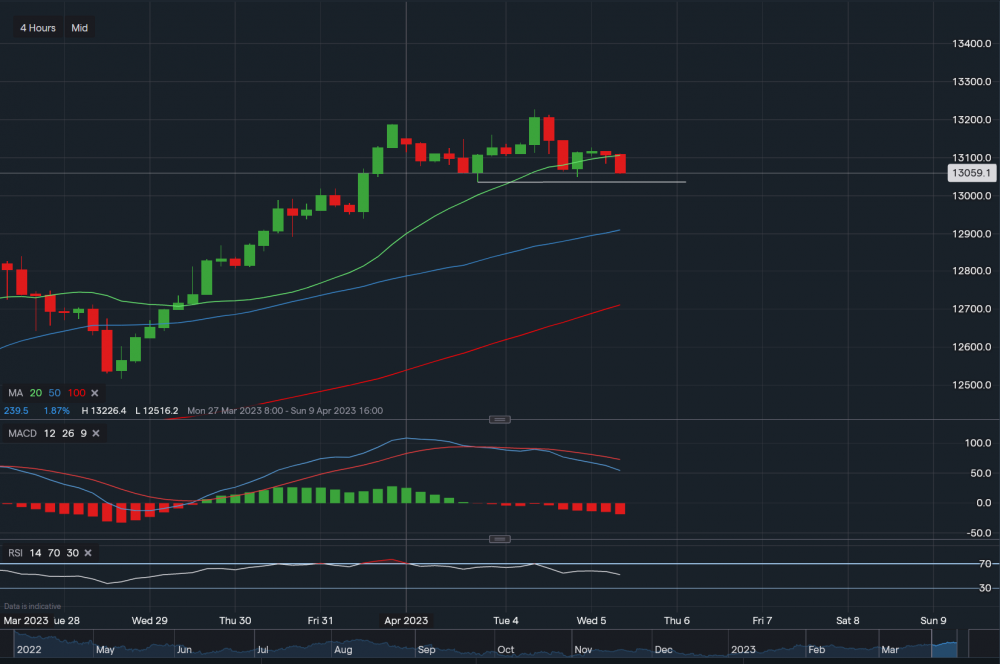
Unsplash.com
From a technical outlook, the NASDAQ is currently trading at around 13,059. Looking at the 4 hourly timeframe. It has dipped below the 20-day moving average and now approaching a key level of support sitting at 13,034 (white trendline). A break and close below this trendline could see the index decline further towards the next level of support sitting at 12,938. Which also corresponds with the 50-day moving average. Current resistance now sits at 13,126 and only a break above this may see the index rise higher back to the levels of 13,150-13,200. Over to the technical indicators, MACD has turned negative but RSI is neutral as it reads 52. Although the RSI is now faltering.
 Earnings Calendar
  Economic Calendar
  VAT Calculator
  Tax Free Childcare Calculator
 Percentage Calculator
 Compound Interest Calculator
  Loan Overpayment Calculator
 Mortgage Calculator
 Credit Card Calculator
 Investing
  Economics
 Trading
  Technical Analysis
  Personal Finance
 Calculator


