Visa (NYSE:) Technical Analysis: Earnings in Focus as Bullish Momentum Builds
$364.68
28 Jul 2026, 15:59
Neutral

Join Minipip Academy and access free courses in investing, trading, economics, and more.
Sign Up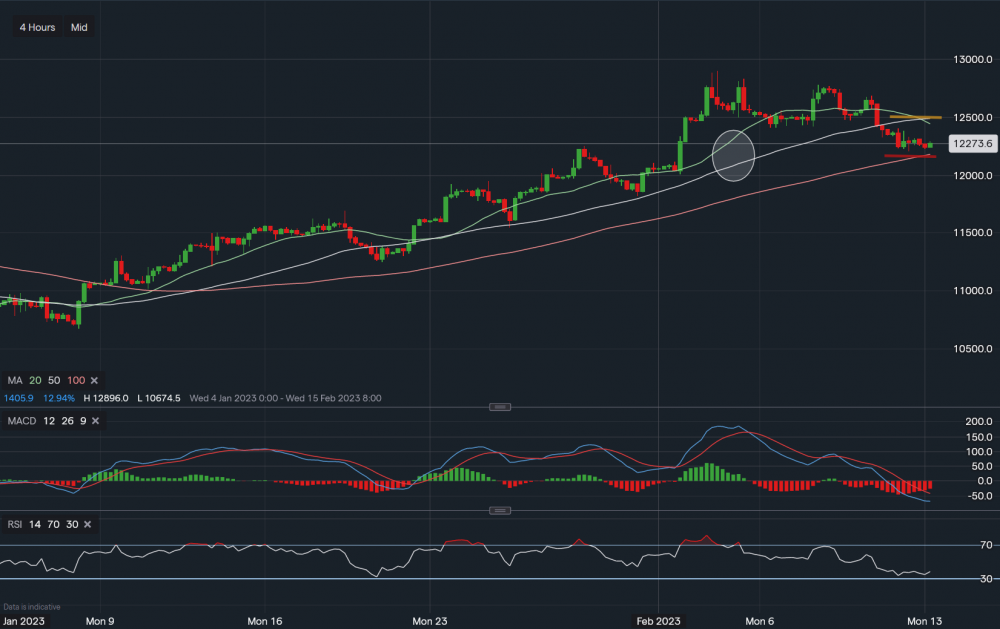
Nasdaq 100 - Chart data IG
The Nasdaq100 fell last week around 3.7%, breaking the 20 & 50 periods SMA along with the trendline support however, on Friday the index was able to make a base at 12,200-12,220 region, with further support at the 100 period moving average at 12,177. A clear break of this on the 4-hourly timeframe could indicate a more natural outlook for the short term, however, if the index can hold support, a bounce towards 12,450 looks feasible this week. Inflation reports are due on Tuesday, which will likely determine the outcome for the remainder of the week. Lower CPI figures could boost the Nasdaq past resistance at 12,450, towards 12,500 and then 13,000 in extension. A higher reading may see a fast drop towards 12,000 as recessionary pressures may not look to be easing.
 Earnings Calendar
  Economic Calendar
  VAT Calculator
  Tax Free Childcare Calculator
 Percentage Calculator
 Compound Interest Calculator
  Loan Overpayment Calculator
 Mortgage Calculator
 Credit Card Calculator
 Investing
  Economics
 Trading
  Technical Analysis
  Personal Finance
 Calculator


