Visa (NYSE:) Technical Analysis: Earnings in Focus as Bullish Momentum Builds
$364.68
28 Jul 2026, 15:59
Neutral

Join Minipip Academy and access free courses in investing, trading, economics, and more.
Sign Up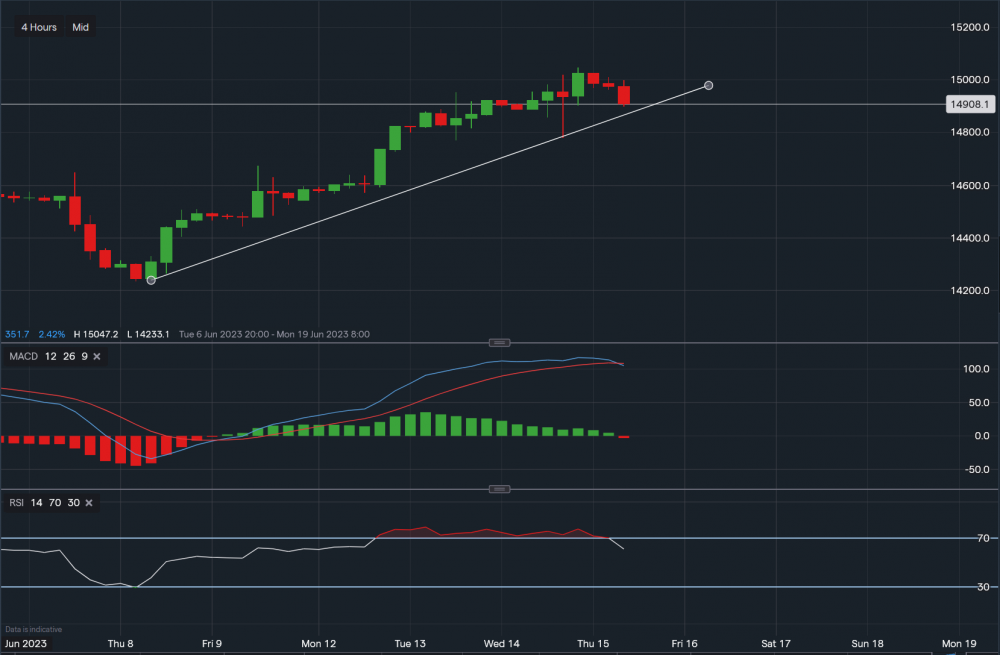
Chart & Data from IG
Despite the Fed halting the rate hikes for the moment, Nasdaq seems like it is retracing. Perhaps on the comments of possible rate hikes in the future to come. Currently trading at around 14,908, it is approaching the support along the ascending trendline (14,858) A break and close below the trendline could see a move lower towards 14,780 and then even towards the range of 14,600-14,650. Looking at the technical indicators, they are both suggesting a pull back may occur. The MACD on the 4 hourly timeframe has now turned negative and the RSI is still positive but faltering as it now reads 60. If the index consolidates along the trendline, we would then look towards the upside. At that point, resistance can then be found at 14,924 then at 14,954. A break above 14,954 could then see the Nasdaq climb higher back to the level of 15,047. Although, the market bias has just turned negative and bears might be taking control (short-term).

Tradable assets:
Min.Deposit:
Max Leverage:
FCA:

Rating:
 Earnings Calendar
  Economic Calendar
  VAT Calculator
  Tax Free Childcare Calculator
 Percentage Calculator
 Compound Interest Calculator
  Loan Overpayment Calculator
 Mortgage Calculator
 Credit Card Calculator
 Investing
  Economics
 Trading
  Technical Analysis
  Personal Finance
 Calculator


