UnitedHealth Group Analysis: Defensive Healthcare Scale Amid Regulatory and Margin Pressures
$407.34
12 Jun 2026, 17:06
Neutral

Join Minipip Academy and access free courses in investing, trading, economics, and more.
Sign Up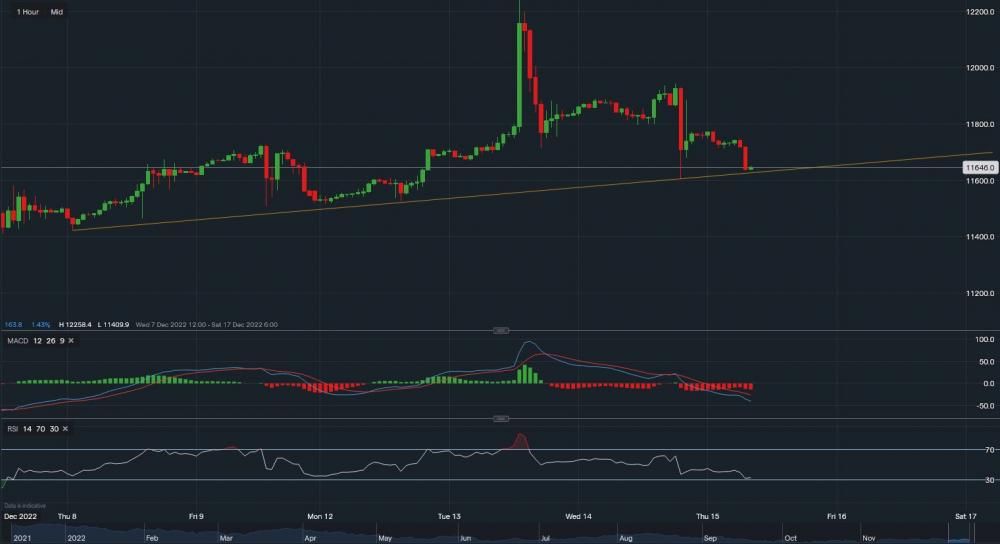
From a technical aspect, Nasdaq is currently trading at around 11,646. On the 1 hourly timeframe, support sits at 11,624, which corresponds with the yellow ascending trendline. The index seems to be in a slight bearish trend as a result of Wednesday's Fed rate decision and comments from Jerome Powell that more rate hikes are to follow. A break below this support level could see the index slide further towards support levels at 11,608 and then at 11,571. Towards the upside, if support was to hold, resistance sits at 11,663 then at 11,689 then at 11,719. A break above 11,719 may create a reversal trend and see Nasdaq continue higher. Looking at the indicators, MACD is currently negative and so is RSI as it reads 32. RSI is floating above 'oversold' territory, so a bounce higher could appear before sliding further, Note to investors: some key data is yet to be released later on in the session that may have an impact.
 Earnings Calendar
  Economic Calendar
  VAT Calculator
  Tax Free Childcare Calculator
 Percentage Calculator
 Compound Interest Calculator
  Loan Overpayment Calculator
 Mortgage Calculator
 Credit Card Calculator
 Investing
  Economics
 Trading
  Technical Analysis
  Personal Finance
 Calculator


