UnitedHealth Group Analysis: Defensive Healthcare Scale Amid Regulatory and Margin Pressures
$407.34
12 Jun 2026, 17:06
Neutral

Join Minipip Academy and access free courses in investing, trading, economics, and more.
Sign Up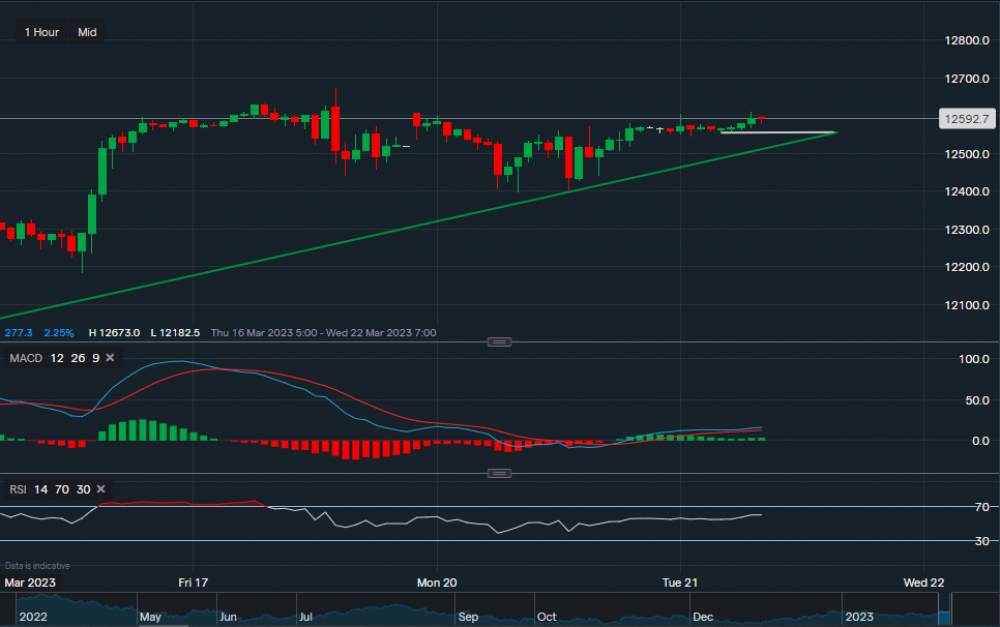
Chart & Data from IG
The Nasdaq is currently trading at around 12,592. From a technical aspect on the 1-hour timeframe, the index is in a bullish stance with resistance sat at 12,610 then at 12,631 then a key level at 12,673. A break above 12,673 could see the Nasdaq climb beyond 12,700, reaching as high as 12,750. Especially after investors have gained slight confidence by the rescue of Credit Suisse over the last couple days. As the bullish momentum is in play at this moment in time, a slight retracement may occur before potentially edging higher. Therefore, we can see there is support along the green ascending trendline and the white horizontal trendline. On the white trendline the support lies at 12,555, a break below this would test support at 12,545 which corresponds more with the green trendline. Both the MACD and the RSI are suggesting positive, with RSI reading 59.
 Earnings Calendar
  Economic Calendar
  VAT Calculator
  Tax Free Childcare Calculator
 Percentage Calculator
 Compound Interest Calculator
  Loan Overpayment Calculator
 Mortgage Calculator
 Credit Card Calculator
 Investing
  Economics
 Trading
  Technical Analysis
  Personal Finance
 Calculator


