UnitedHealth Group Analysis: Defensive Healthcare Scale Amid Regulatory and Margin Pressures
$407.34
12 Jun 2026, 17:06
Neutral

Join Minipip Academy and access free courses in investing, trading, economics, and more.
Sign Up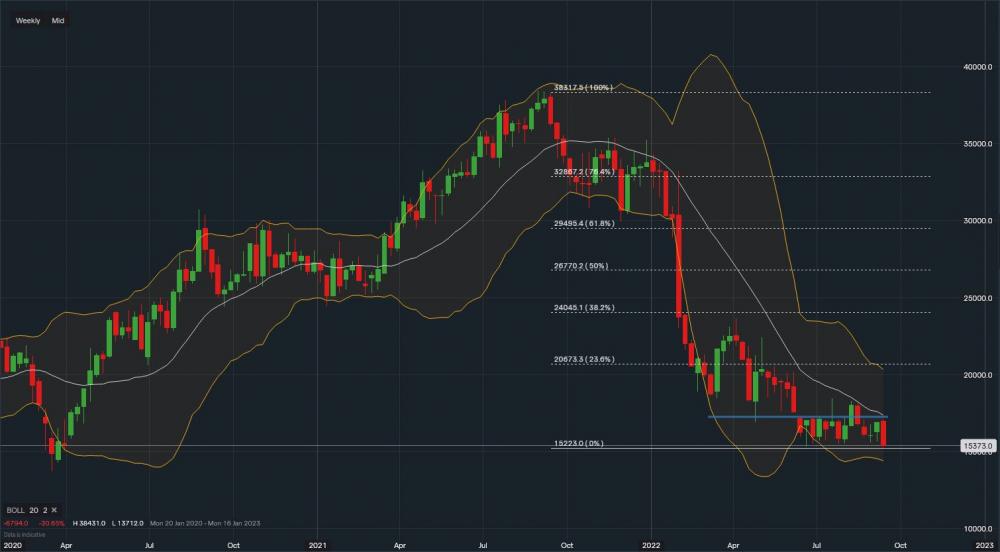
From a technical perspective, a major support level sits at $152. A break below this could see the stock test the lows of the pandemic period back in March 2020 ($137). RSI is negative as it reads 36 however MACD is showing a neutral stance. Initial short-term resistance sits at $173 where the stock has continued to struggle to break higher (this is also the middle moving average of the Bollinger). Applying the Fibonacci retracement to the chart, the next resistance reads $203-$206 region, this is where the 23.6% fib and upper Bollinger both meet.
Comment. “Overall, operations have continued to feel the pressure due to TikTok taking some of Metas business away, the metaverse vision continues to eat into their cash reserves and currently doesn’t really have the traction that Mark Zuckerberg thought he would get.”
 Earnings Calendar
  Economic Calendar
  VAT Calculator
  Tax Free Childcare Calculator
 Percentage Calculator
 Compound Interest Calculator
  Loan Overpayment Calculator
 Mortgage Calculator
 Credit Card Calculator
 Investing
  Economics
 Trading
  Technical Analysis
  Personal Finance
 Calculator


