UnitedHealth Group Analysis: Defensive Healthcare Scale Amid Regulatory and Margin Pressures
$407.34
12 Jun 2026, 17:06
Neutral

Join Minipip Academy and access free courses in investing, trading, economics, and more.
Sign Up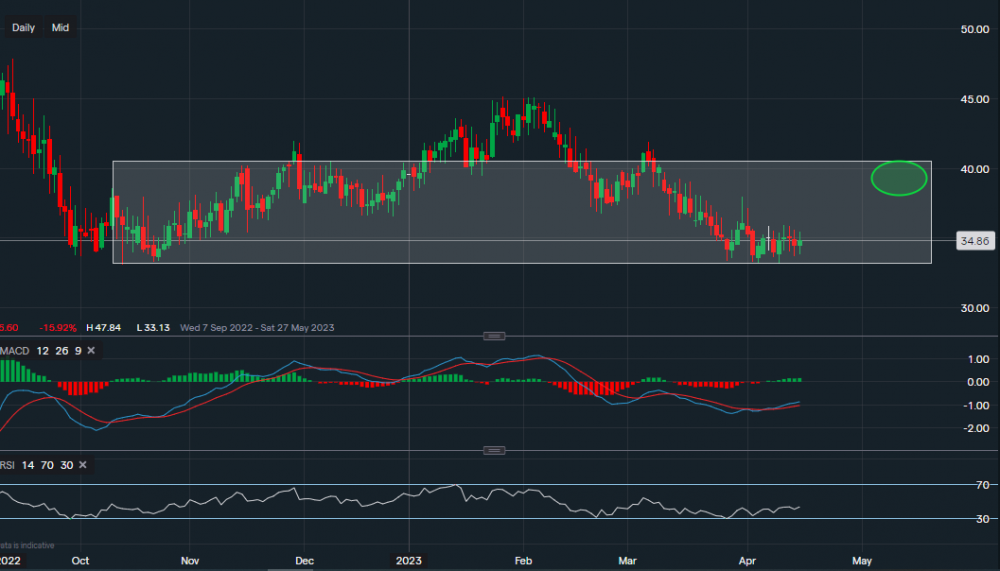
Chart & Data from IG
Taking a look at Marston’s PLC as its stock seems like it may have found a base of support, after trying to consolidate over the past trading week. Its share price currently sits around 34p a share, with a support base below at 33p (lower trendline of the rectangle). A break and close below this base could see the price decline further towards 28p and even as low as 18p. As it has reached that level in the past. However, looking at the history of the chart, we can see that in October last year, we had a similar situation. Perhaps a bounce higher is pending, therefore resistance above sits at 35p and then at 37p. A break above 37p may even see a move higher towards the tough resistance point at 40p (green oval). Thought this is more likely in the midterm. Looking at the technical indicators, MACD is slightly positive but RSI is negative as it reads 41.
 Earnings Calendar
  Economic Calendar
  VAT Calculator
  Tax Free Childcare Calculator
 Percentage Calculator
 Compound Interest Calculator
  Loan Overpayment Calculator
 Mortgage Calculator
 Credit Card Calculator
 Investing
  Economics
 Trading
  Technical Analysis
  Personal Finance
 Calculator


