UnitedHealth Group Analysis: Defensive Healthcare Scale Amid Regulatory and Margin Pressures
$407.34
12 Jun 2026, 17:06
Neutral

Join Minipip Academy and access free courses in investing, trading, economics, and more.
Sign Up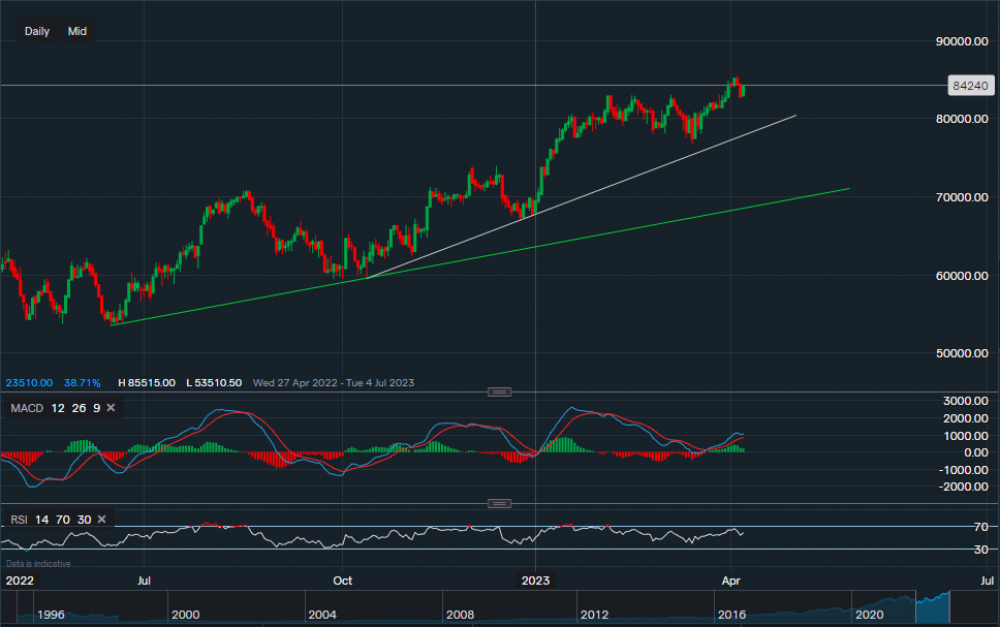
Chart & Data from IG
Taking a look at the luxurious fashion giant Louis Vuitton in this instance. From a technical overview the company’s shares are trading at around €842.40 a share. We can see that on the daily interval the support is well established below, with the first key level sitting at €788.09 (along the white trendline). A break below this trendline could then see a test of support at €701.19, which is located along the green trendline. The green supportive trendline in theory would be classed as ‘major’ support in this case, meaning a break and a price close below it could result in a formation of a bearish trend and a huge selloff. However, the stock has been in a bullish trend for some time now and the momentum remains. Therefore, looking towards the upside, resistance sits at €855.15 which is also the all-time high. A break and close above this price level may see the stock reach a new all-time high. LV is due to report earnings tomorrow (12th), positive earnings may add some extra momentum with an attempt to edge higher. Over to the technical indicators, MACD is positive but lowered slightly just before the easter break, and RSI also positive as it reads 58.
 Earnings Calendar
  Economic Calendar
  VAT Calculator
  Tax Free Childcare Calculator
 Percentage Calculator
 Compound Interest Calculator
  Loan Overpayment Calculator
 Mortgage Calculator
 Credit Card Calculator
 Investing
  Economics
 Trading
  Technical Analysis
  Personal Finance
 Calculator


