Visa (NYSE:) Technical Analysis: Earnings in Focus as Bullish Momentum Builds
$364.68
28 Jul 2026, 15:59
Neutral

Join Minipip Academy and access free courses in investing, trading, economics, and more.
Sign Up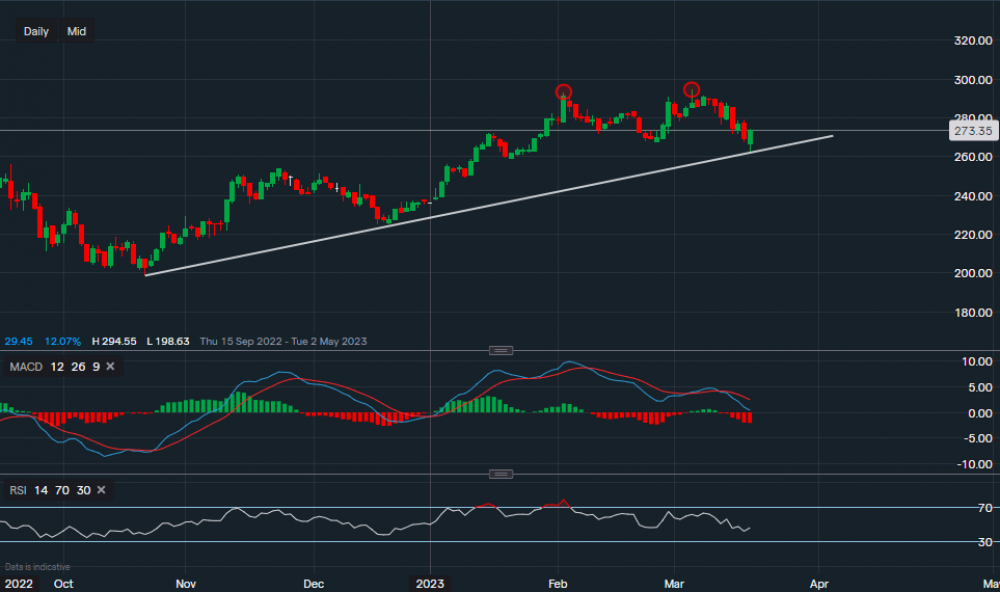
Chart & Data from IG
From a technical perspective, the bias of Kingfisher’s stock is still bullish on the daily interval. We can see a nice ascending trendline with various support levels below. The price failed to move past 293p on the 2nd of February then reached 294p on March the 6th and retraced once again. Today it has tested the support along the trendline sitting at 262p and bounced right off it, potentially forming another attempt to break through the key resistance levels sitting at 293p and 294p (highlighted by red ovals). A break above those levels could see the price hike further towards the 300p mark. However, Kingfisher is expected to report some earnings tomorrow and a negative report may cause some volatility. Therefore, a break below the support at 262p may see the price dip further towards 258p and 249p. MACD is currently negative from the recent retracement but RSI is neutral as it reads 45.
 Earnings Calendar
  Economic Calendar
  VAT Calculator
  Tax Free Childcare Calculator
 Percentage Calculator
 Compound Interest Calculator
  Loan Overpayment Calculator
 Mortgage Calculator
 Credit Card Calculator
 Investing
  Economics
 Trading
  Technical Analysis
  Personal Finance
 Calculator


