UnitedHealth Group Analysis: Defensive Healthcare Scale Amid Regulatory and Margin Pressures
$407.34
12 Jun 2026, 17:06
Neutral

Join Minipip Academy and access free courses in investing, trading, economics, and more.
Sign Up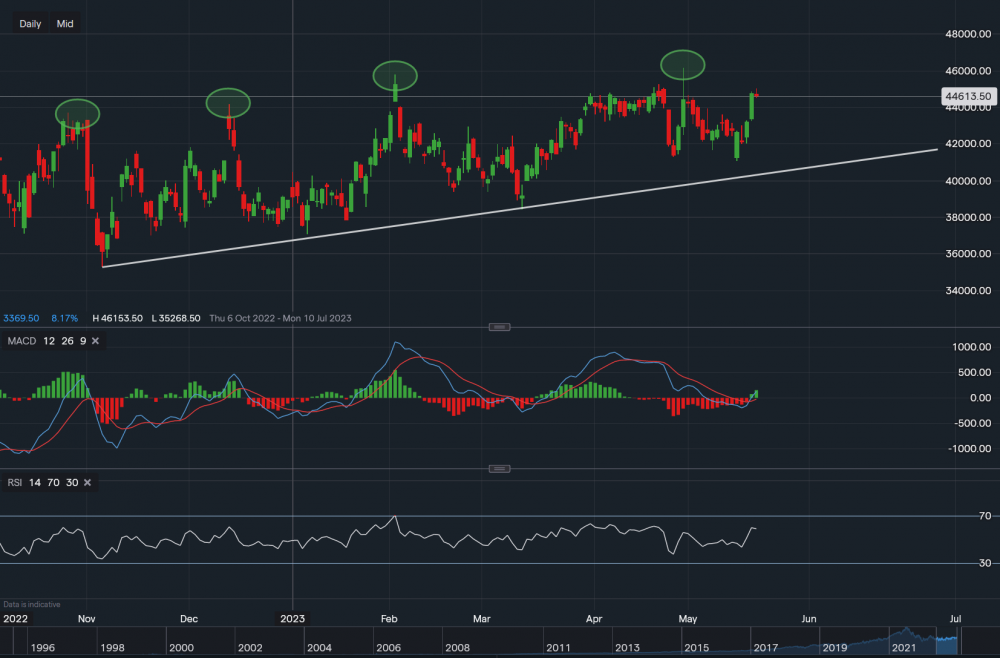
Chart & Data from IG
Taking a look at Intuit as the software company is expected to report its quarterly earnings tomorrow. At this moment in time, its shares are trading at around $446.13 a share. We can see on the daily timeframe that it has formed multiple levels of support along the trendline while creating higher highs and higher lows as it’s climbing higher. The first key support level sits at $410.64 followed by $406.61, which sits roughly on the trendline. A break below $406.61 could see the price slide lower towards the next key level sitting at $384.27. But, as the bias remains positive, the price faces minor resistance at $447.91 then at $452.73 then at $457.86. A break above $457.86 could see a move towards the most recent high of $461.53. Looking at the indicators, MACD has turned positive and RSI is already positive as it reads 59.
Note: Investors and traders should be cautious as the earnings report tomorrow may have an influence on the direction of the price in the short-mid term.

Tradable assets:
Min.Deposit:
Max Leverage:
FCA:

Rating:
 Earnings Calendar
  Economic Calendar
  VAT Calculator
  Tax Free Childcare Calculator
 Percentage Calculator
 Compound Interest Calculator
  Loan Overpayment Calculator
 Mortgage Calculator
 Credit Card Calculator
 Investing
  Economics
 Trading
  Technical Analysis
  Personal Finance
 Calculator


