Microsoft (MSFT): AI Leadership Supports Long-Term Growth
$396.94
21 Jul 2026, 22:43
Neutral

Join Minipip Academy and access free courses in investing, trading, economics, and more.
Sign Up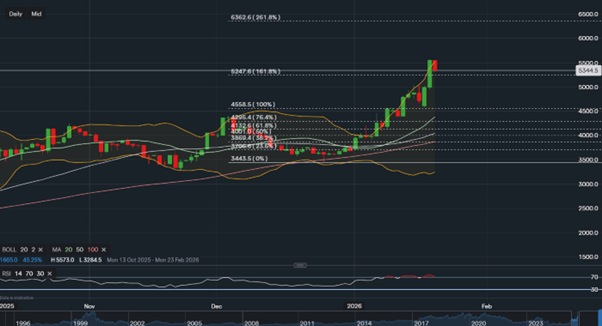
Intel Share Price Analysis: Bullish Rally, Overbought Signals, and What Comes Next
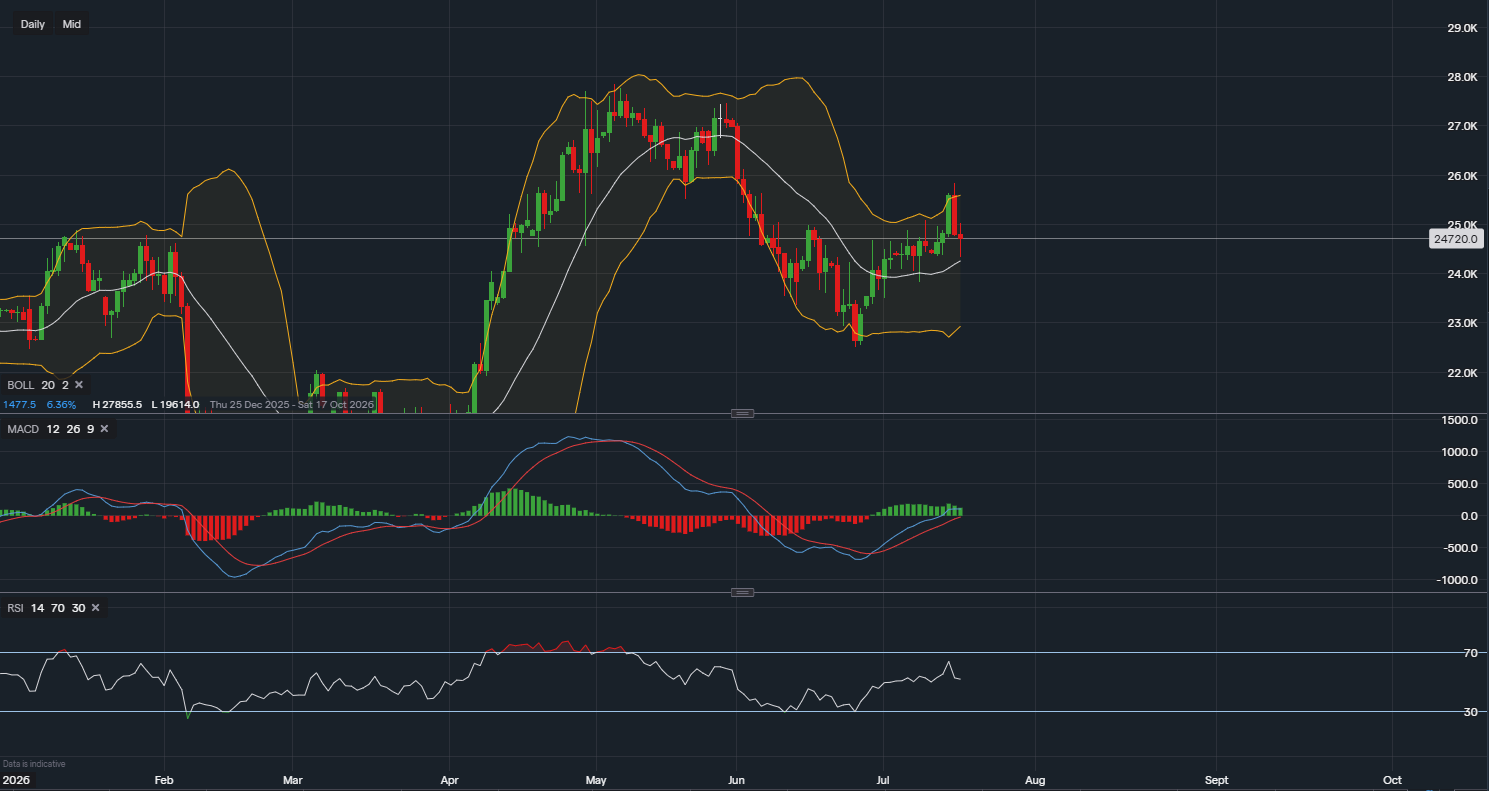
Intel shares have experienced a strong bullish rally over the past three weeks, with the share price rising by approximately 54.07%. While this surge reflects renewed investor optimism, several technical indicators now suggest Intel may be overbought, raising the question: is a bearish reversal imminent, or is the stock simply undergoing a short-term pullback within a broader bullish trend?
What Drove Intel’s Recent Bullish Rally?
Intel’s latest bullish move began on Monday, 29 December, largely driven by surging demand for CPUs. This demand is being fuelled by hyperscale data centres, as companies rapidly expand infrastructure to support AI-driven workloads. The renewed strength in enterprise and data-centre demand has helped shift market sentiment in Intel’s favour after a challenging period.
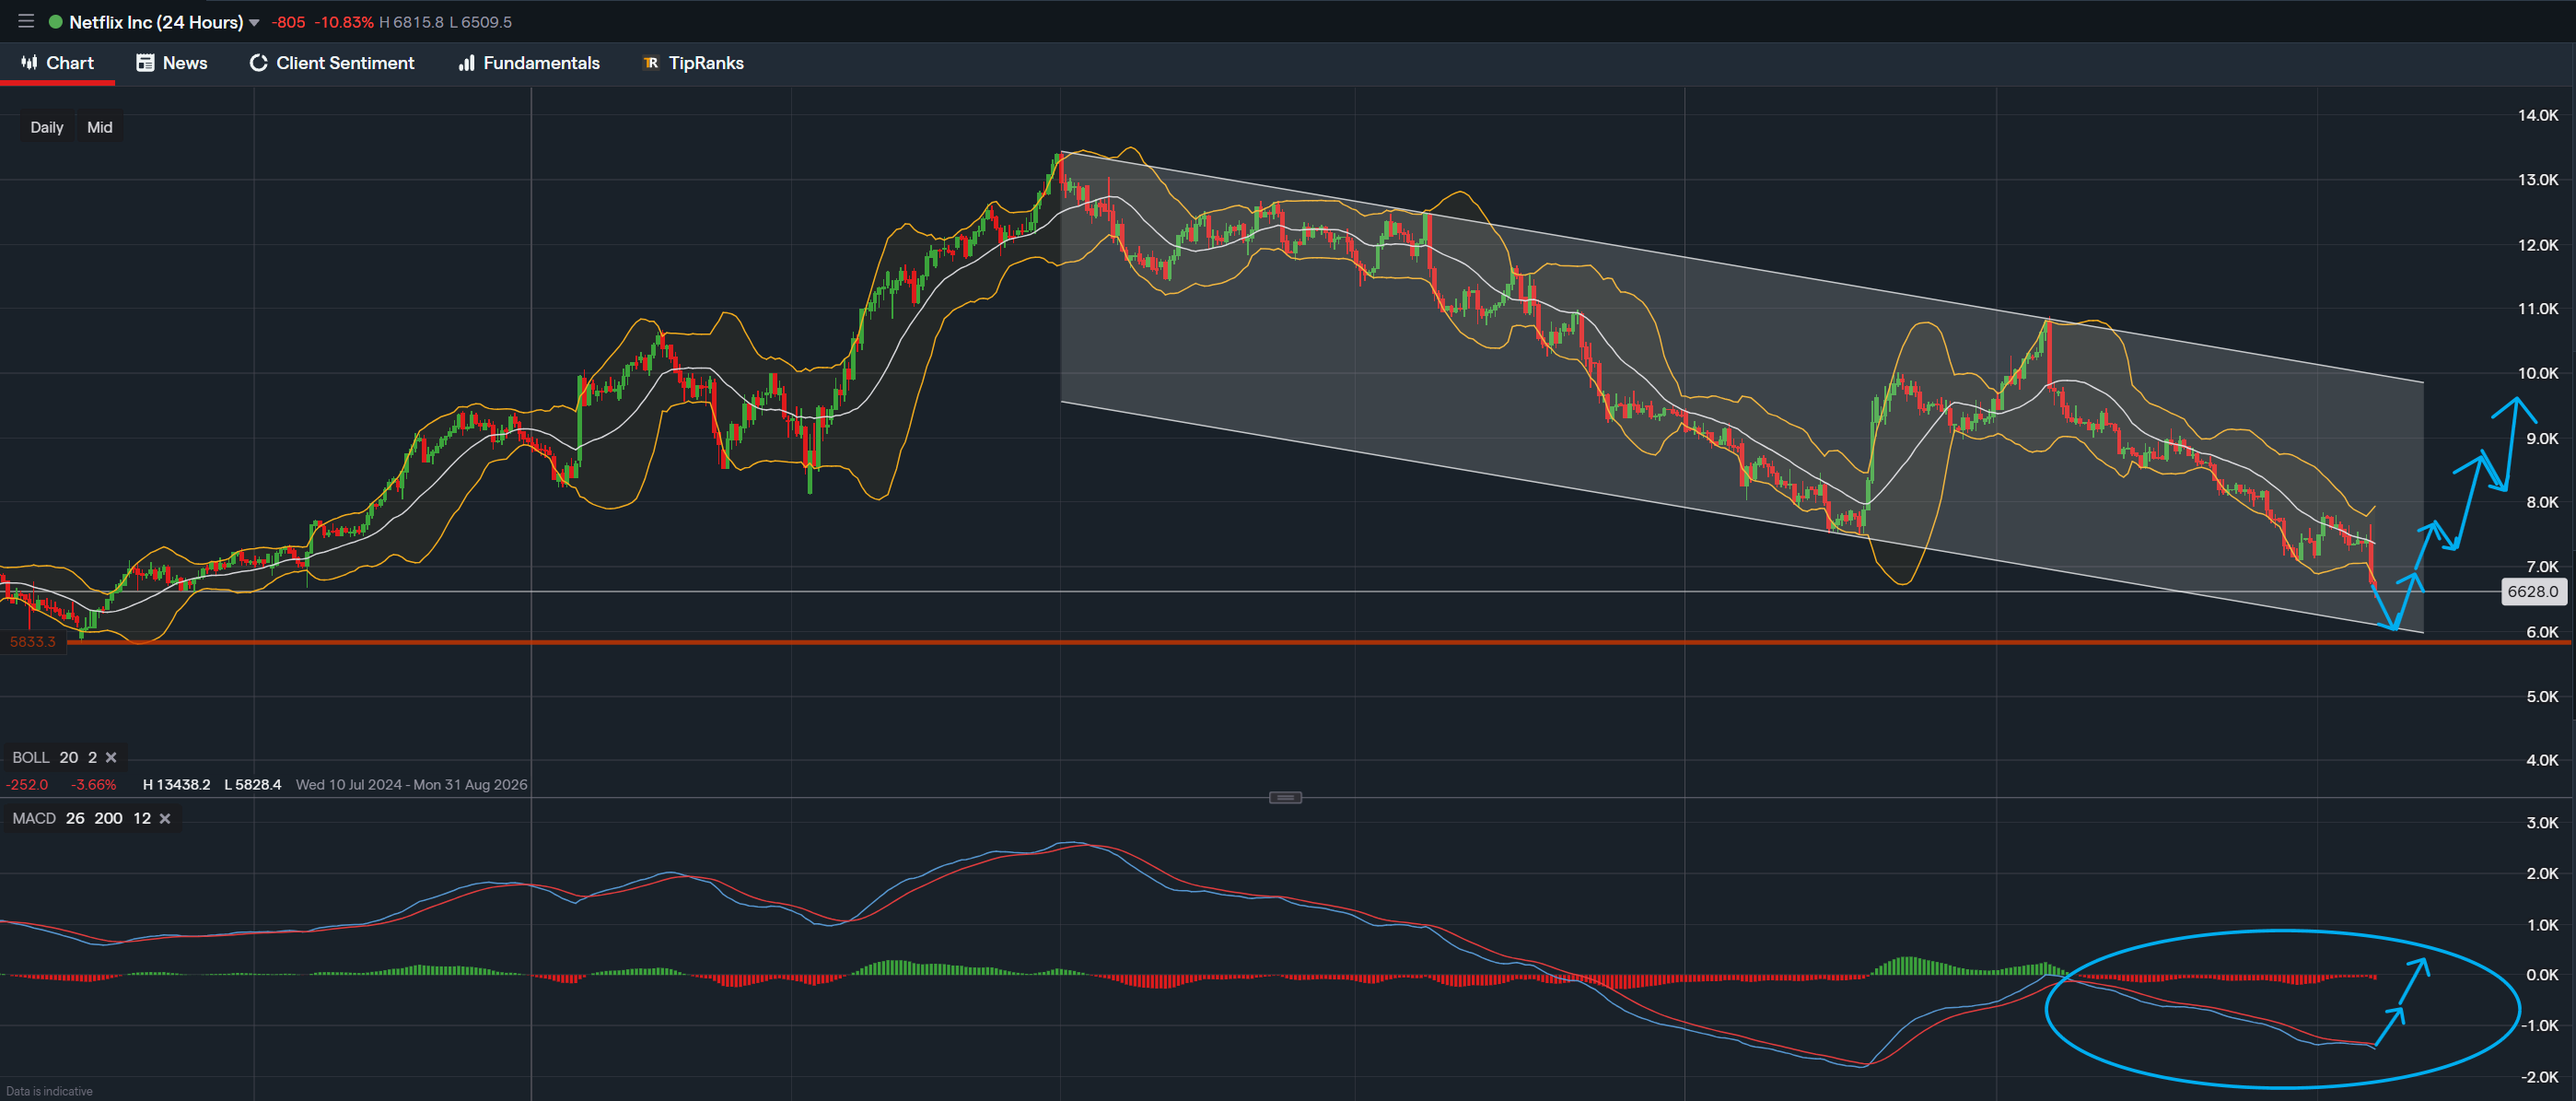
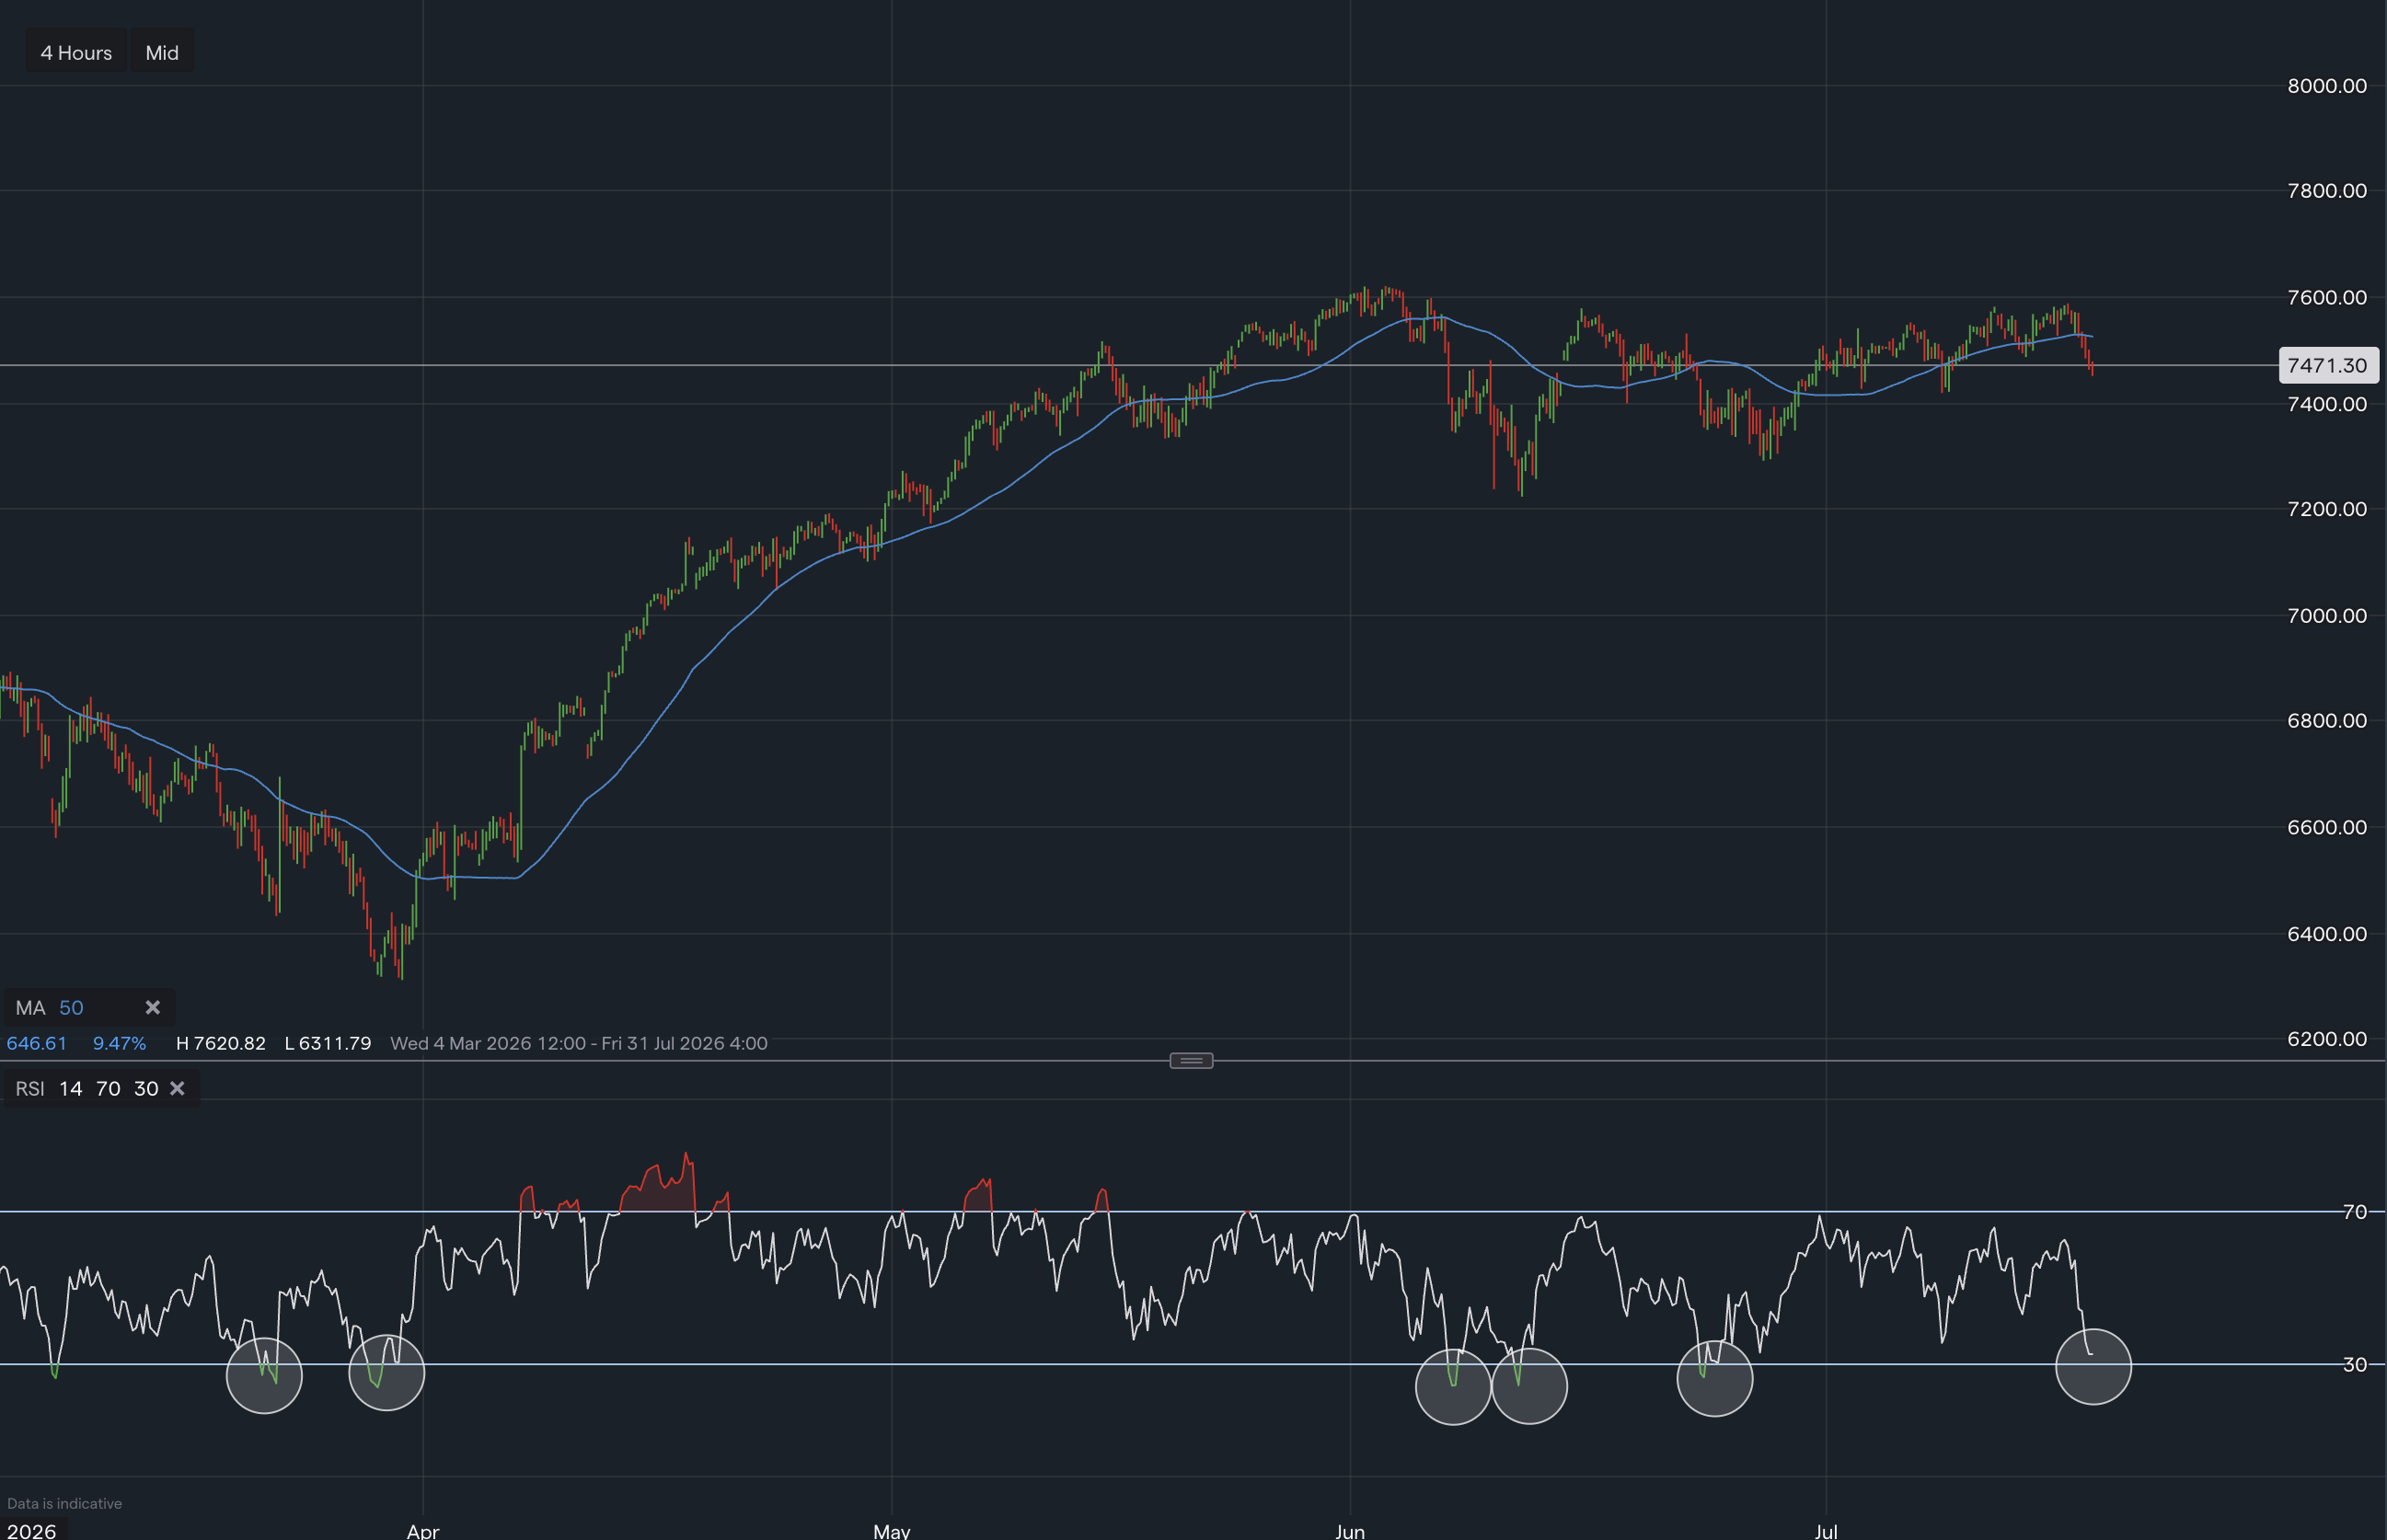
Technical Analysis: Signs of an Overbought Market
From a technical perspective, several indicators suggest caution may be warranted in the near term:
As a result, attention is now turning to key support levels, including:
These signals suggest Intel could experience a bearish reversal or consolidation phase before any sustained move higher.
Fundamental Analysis: Explaining Intel’s Extreme P/E Ratios
Fundamentally, Intel currently trades with a trailing P/E ratio of 5,078.77 and a forward P/E ratio of 87.24. While this disparity may appear alarming, it is best explained by distorted recent earnings versus expected recovery.
The extremely high trailing P/E ratio is the result of near-zero earnings over the past 12 months, caused by:
Looking ahead, however, Intel is expected to see a gradual earnings recovery over the next 12 months, driven by:
Analyst Sentiment and Price Targets
Most analysts currently maintain a “Hold” rating on Intel shares, reflecting cautious optimism over the company’s long-term recovery. However, with an average price target of $44.55, representing an 8.26% downside, analysts suggest that share prices may weaken further in the short term before the recovery narrative fully materialises.
Outlook for Traders and Long-Term Investors
Short-term traders may find Intel less attractive at present, as overbought technical conditions point towards a potential bearish reversal or corrective pullback.
Long-term investors, however, may view Intel differently. If the company successfully executes its recovery strategy, the next one to two years could present a compelling opportunity as earnings, margins, and competitiveness improve.
Final Thoughts

Tradable assets:
Min.Deposit:
Max Leverage:
FCA:

Rating:
 Earnings Calendar
  Economic Calendar
  VAT Calculator
  Tax Free Childcare Calculator
 Percentage Calculator
 Compound Interest Calculator
  Loan Overpayment Calculator
 Mortgage Calculator
 Credit Card Calculator
 Investing
  Economics
 Trading
  Technical Analysis
  Personal Finance
 Calculator