UnitedHealth Group Analysis: Defensive Healthcare Scale Amid Regulatory and Margin Pressures
$407.34
12 Jun 2026, 17:06
Neutral

Join Minipip Academy and access free courses in investing, trading, economics, and more.
Sign Up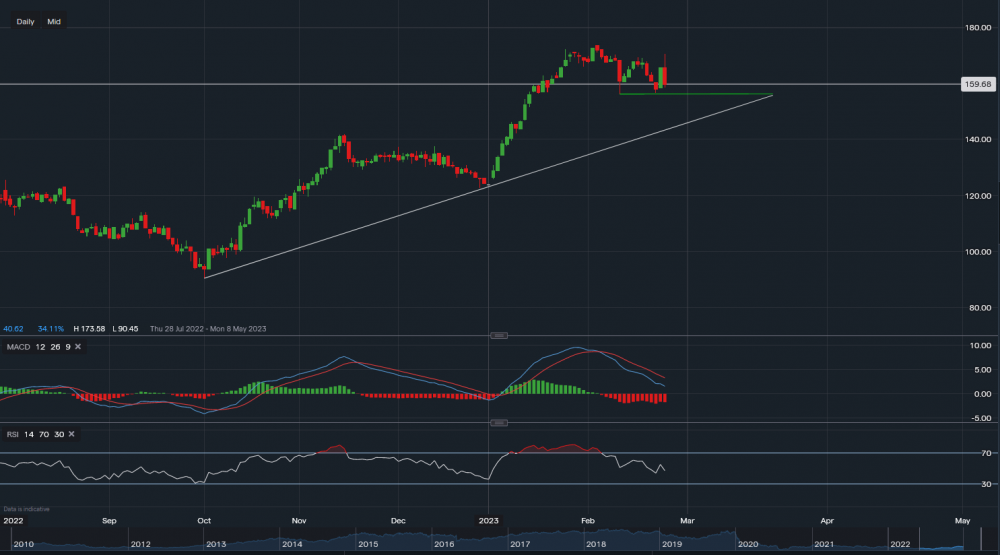
IAG - Chart & Data from IG
From a technical viewpoint, IAG’s shares are currently trading at around 159p a share. On the daily interval, we can see that support sits at 156p (green trendline), a break below this trendline could see the price decline further towards 145-146p, which sits along the white trendline. IAG’s stock has been in an uptrend since October last year, it is up around 29% since the start of 2023. Therefore, looking towards further upside, resistance sits at 162p then at 165p then at 169p. A break above 169p may see the price head back up towards 173p, last seen on February 3rd. Technical indicators are mixed, MACD is negative but RSI is neutral as it reads 47. IAG has reported earnings of 5.6p on revenue of £23.06bn versus forecasts of -0.0119 on revenue of £6.2bn. This may have an influence on the stock in the days to come.
 Earnings Calendar
  Economic Calendar
  VAT Calculator
  Tax Free Childcare Calculator
 Percentage Calculator
 Compound Interest Calculator
  Loan Overpayment Calculator
 Mortgage Calculator
 Credit Card Calculator
 Investing
  Economics
 Trading
  Technical Analysis
  Personal Finance
 Calculator


