UnitedHealth Group Analysis: Defensive Healthcare Scale Amid Regulatory and Margin Pressures
$407.34
12 Jun 2026, 17:06
Neutral

Join Minipip Academy and access free courses in investing, trading, economics, and more.
Sign Up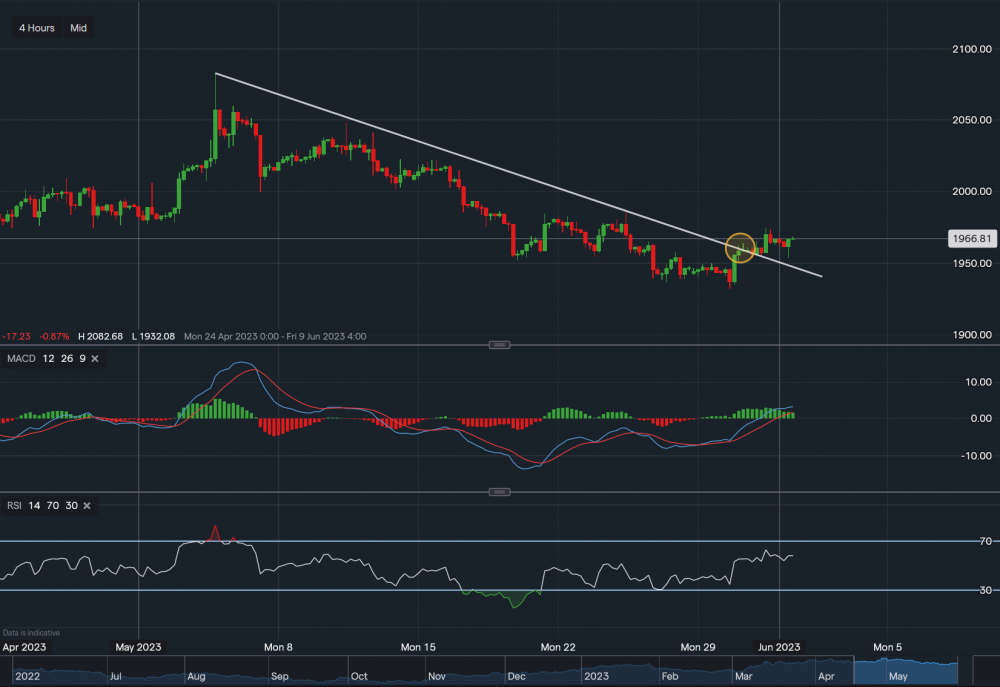
Chart & Data from IG
Taking a look at gold as it has broken above the descending trendline dating back to the 3rd of May. It has moved above the resistance level of $1,959 (oval), and now seems like it’s trying to consolidate after the slight retracement in the overnight session. Currently, the commodity is trading at around $1,966 an ounce with support below at $1,953. A break below this point could indicate a ‘false breakout’ and lead to a move lower back towards $1,935-$1,940 an ounce. On the other hand, towards the upside, resistance now sits at $1,974. A break above this point could see the price of gold climb higher with the target then of $1,985. Looking at the technical indicators, MACD is positive and so is RSI as it reads 58.

Tradable assets:
Min.Deposit:
Max Leverage:
FCA:

Rating:
 Earnings Calendar
  Economic Calendar
  VAT Calculator
  Tax Free Childcare Calculator
 Percentage Calculator
 Compound Interest Calculator
  Loan Overpayment Calculator
 Mortgage Calculator
 Credit Card Calculator
 Investing
  Economics
 Trading
  Technical Analysis
  Personal Finance
 Calculator


