Visa (NYSE:) Technical Analysis: Earnings in Focus as Bullish Momentum Builds
$364.68
28 Jul 2026, 15:59
Neutral

Join Minipip Academy and access free courses in investing, trading, economics, and more.
Sign Up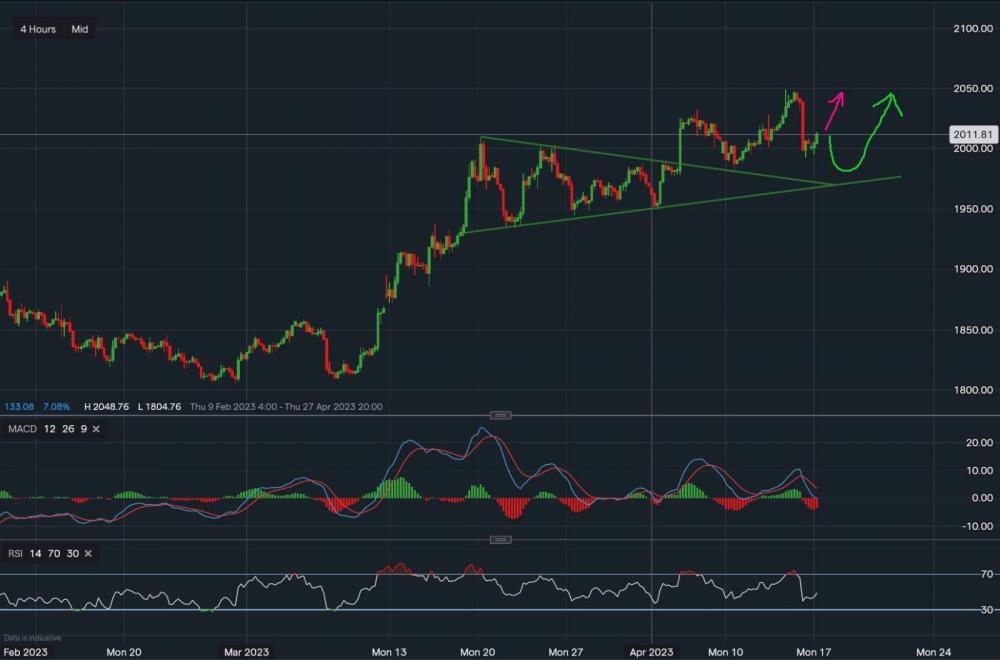
Chart & Data from IG
From a technical perspective, gold is currently trading at around $2,011 an ounce. After a heavy fall on Friday, it looks like consolidation may be taking place with the upside target being $1,945-$1,950 again this week (at this moment in time). Although resistance resting at $2,032 will be tough point to overcome. Towards the downside, support sits at $1,992 followed by $1,982. A break below $1,982 could see a test of the support along the ascending trendline which was formed during the last week in March ($1,970). Looking at the technical indicators, MACD remains strongly negative but RSI is now neutral as it reads 45.
 Earnings Calendar
  Economic Calendar
  VAT Calculator
  Tax Free Childcare Calculator
 Percentage Calculator
 Compound Interest Calculator
  Loan Overpayment Calculator
 Mortgage Calculator
 Credit Card Calculator
 Investing
  Economics
 Trading
  Technical Analysis
  Personal Finance
 Calculator


