Visa (NYSE:) Technical Analysis: Earnings in Focus as Bullish Momentum Builds
$364.68
28 Jul 2026, 15:59
Neutral

Join Minipip Academy and access free courses in investing, trading, economics, and more.
Sign Up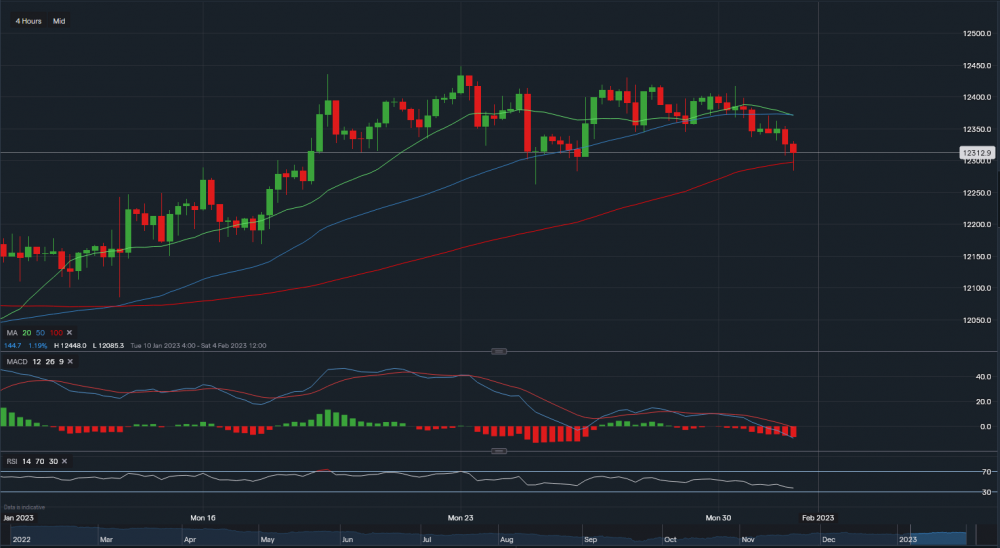
GBP/USD - Chart & Data from IG
Technicals
As we can see on the chart, the GBP/USD is currently trading at around £1.2312. From a technical overview, key support sits at £1.2297, as per the 100-day moving average on the 4-hour interval. A break and close below this price could indicate further downside, therefore, the next key support levels sit at £1.2263 then at £1.2168. However, as the pound has been falling since last Friday and the longer-term bias is bullish, we could see some consolidation over the next 24 hours. Hence, resistance above currently sits at £1.2330 then at £1.2342 then a key point at £1.2370 (corresponds to the 50-day moving average). A break above the 50-day MA may see the pound climb back up towards the £1.2400-£1.2450 price range. Taking a look at the technical indicators, MACD is strongly negative and so is RSI as it reads 36. Although, RSI is floating above ‘oversold’ territory.
 Earnings Calendar
  Economic Calendar
  VAT Calculator
  Tax Free Childcare Calculator
 Percentage Calculator
 Compound Interest Calculator
  Loan Overpayment Calculator
 Mortgage Calculator
 Credit Card Calculator
 Investing
  Economics
 Trading
  Technical Analysis
  Personal Finance
 Calculator


