Visa (NYSE:) Technical Analysis: Earnings in Focus as Bullish Momentum Builds
$364.68
28 Jul 2026, 15:59
Neutral

Join Minipip Academy and access free courses in investing, trading, economics, and more.
Sign Up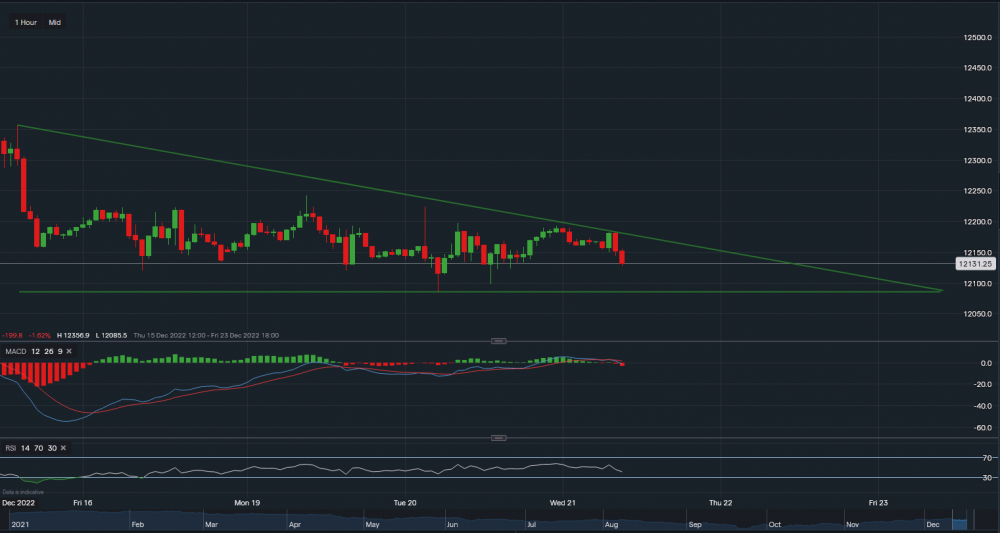
GBP/USD - Chart & Data from IG
From a technical overview, the pound is currently trading at around £1.2131 against the dollar. It is struggling to find a course of direction and on the 1 hourly timeframe, it is rangebound between £1.2085 and £1.2242. Towards the downside, support levels sit at £1.2124 then at £1.2114 then at £1.2098. A break below these price levels could see the pound fall towards the key support level of £1.2085. Towards the upside, resistance sits at £1.2147 then at ££1.2158 then at £1.2163 (just below the upper green trendline of the triangle). A break above these levels may see the pound head back towards that peak level of £1.2242. Looking at the technical indicators, MACD has turned negative and RSI is faltering as it now reads 42.
 Earnings Calendar
  Economic Calendar
  VAT Calculator
  Tax Free Childcare Calculator
 Percentage Calculator
 Compound Interest Calculator
  Loan Overpayment Calculator
 Mortgage Calculator
 Credit Card Calculator
 Investing
  Economics
 Trading
  Technical Analysis
  Personal Finance
 Calculator


