Salesforce Stock Analysis: Technical Indicators Suggest a Potential Upside Move
$$248.22
Salesforce Stock Analysis: Technical Indicators Suggest a Potential Upside Move
16 Oct 2025, 13:05

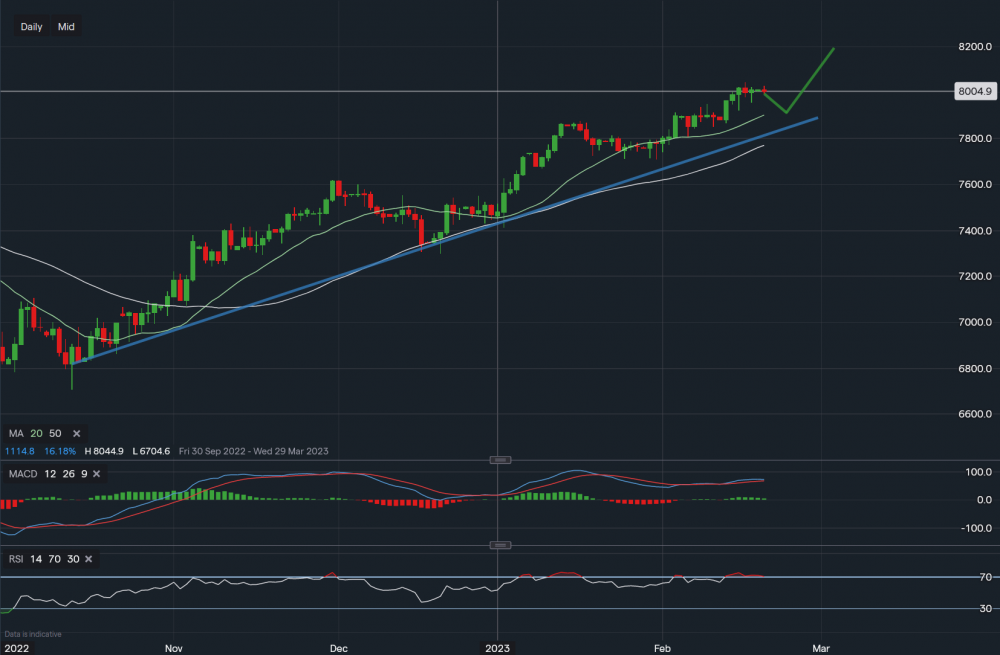
FTSE100 - Chart data IG

The FTSE100 continues to consolidate around the 8,000 region, which in the grand scheme of things is okay, however, a few flags are currently raised in our opinion. RSI on the daily is overbought reading 70 with MACD starting to roll over. The FTSE is also 120 points away from its 20-period SMA. The last 3 times the FTSE was in this position the index did fall, however, the downside was limited and provided good buying opportunities. Looking at levels to watch initial support for FTSE sits at 7,901 followed by 7,807 and then 7769. Towards the upside, a break of the all-time-highs at 8,044 could see a move up towards 8,100 and then 8,200 in the medium term. A weak GBP will help keep the FTSE buoyed at the 8,000 level, but a sharp rise in the pound could easily put the FTSE on the back foot. This is definitely a market to watch.