UnitedHealth Group Analysis: Defensive Healthcare Scale Amid Regulatory and Margin Pressures
$407.34
12 Jun 2026, 17:06
Neutral

Join Minipip Academy and access free courses in investing, trading, economics, and more.
Sign Up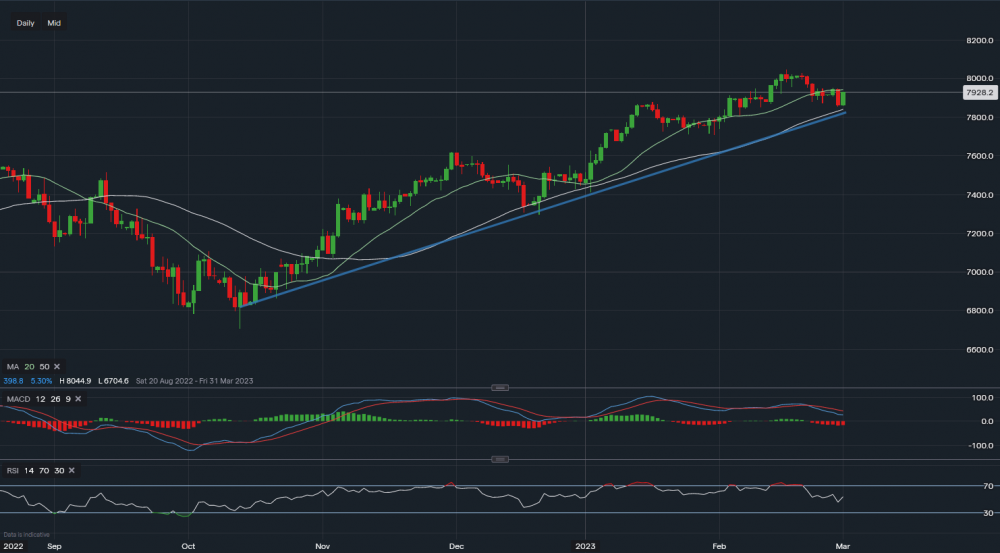
FTSE 100 - Chart & Data from IG
Following on from the previous post we expected FTSE to retrace back towards trendline support for a further push higher, over the last 8 days, the FTSE has done just that pulling back towards support at 7,900 to now find a base. MACD is actually trending negative at the moment with an RSI reading of 54, therefore suggesting a neutral bias. The FTSE does have some tough resistance above at 7,942 followed by 8,000 and then the 8,044 swing high. Towards the downside, support for the index sits at 7,840 where the 100 MA & trendline sits. A break of this level here could see the index turn much lower. It is important to take into account the value of the GBPUSD pair, if the GBP spikes in the short term, the FTSE will be made with more resistance, if the GPB falls, it could help push the FTSE back towards the highs.
 Earnings Calendar
  Economic Calendar
  VAT Calculator
  Tax Free Childcare Calculator
 Percentage Calculator
 Compound Interest Calculator
  Loan Overpayment Calculator
 Mortgage Calculator
 Credit Card Calculator
 Investing
  Economics
 Trading
  Technical Analysis
  Personal Finance
 Calculator


