Visa (NYSE:) Technical Analysis: Earnings in Focus as Bullish Momentum Builds
$364.68
28 Jul 2026, 15:59
Neutral

Join Minipip Academy and access free courses in investing, trading, economics, and more.
Sign Up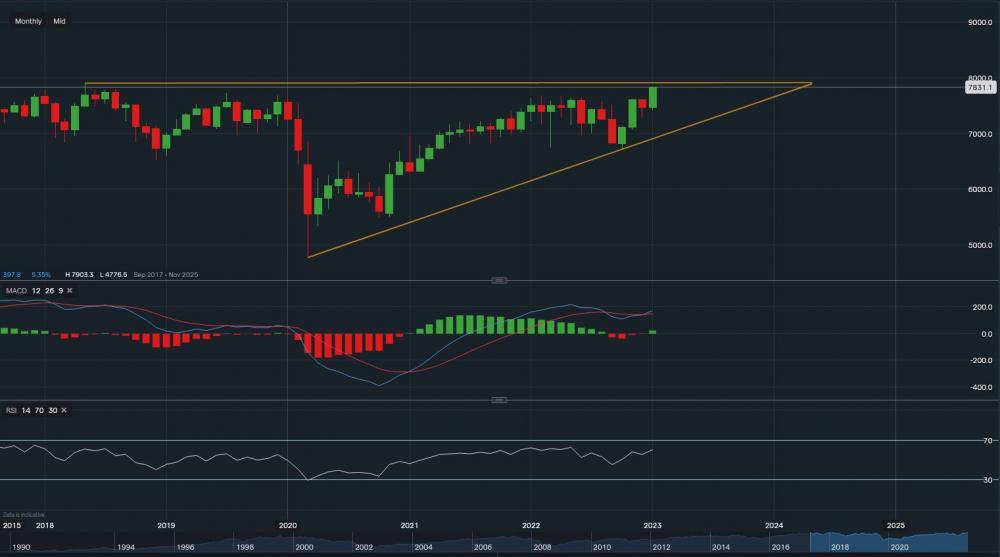
FTSE 100 - Chart & Data from IG
The FTSE 100 has been a roll from the start of 2023. Currently trading at around 7831 and only 72 points away its all-time high. From a technical perspective, looking at the monthly timeframe, the index seems to have formed an ascending triangle with the key resistance above at 7,831 (corresponds with the upper trendline of the triangle). A break above this resistance level could see the FTSE set a new record high at around 8,000 and potentially higher in Q1 of 2023. Towards the downside, support sits at 7,536 then at 7,296 then a major point at 7,136 (rests on the lower trendline of the triangle). A break below this trendline may see the index fall back towards the 7,000 mark and maybe even further towards 6,700-6,800. Looking at the technical indicators, MACD has turned positive this month and RSI reads 60. Despite ongoing worries about the recession, FTSE 100 maintains its momentum and could even break the key resistance this month. Longer-term, if inflation continues to as it is or rises back up, then downfalls may re-occur in the upcoming months.
 Earnings Calendar
  Economic Calendar
  VAT Calculator
  Tax Free Childcare Calculator
 Percentage Calculator
 Compound Interest Calculator
  Loan Overpayment Calculator
 Mortgage Calculator
 Credit Card Calculator
 Investing
  Economics
 Trading
  Technical Analysis
  Personal Finance
 Calculator


