UnitedHealth Group Analysis: Defensive Healthcare Scale Amid Regulatory and Margin Pressures
$407.34
12 Jun 2026, 17:06
Neutral

Join Minipip Academy and access free courses in investing, trading, economics, and more.
Sign Up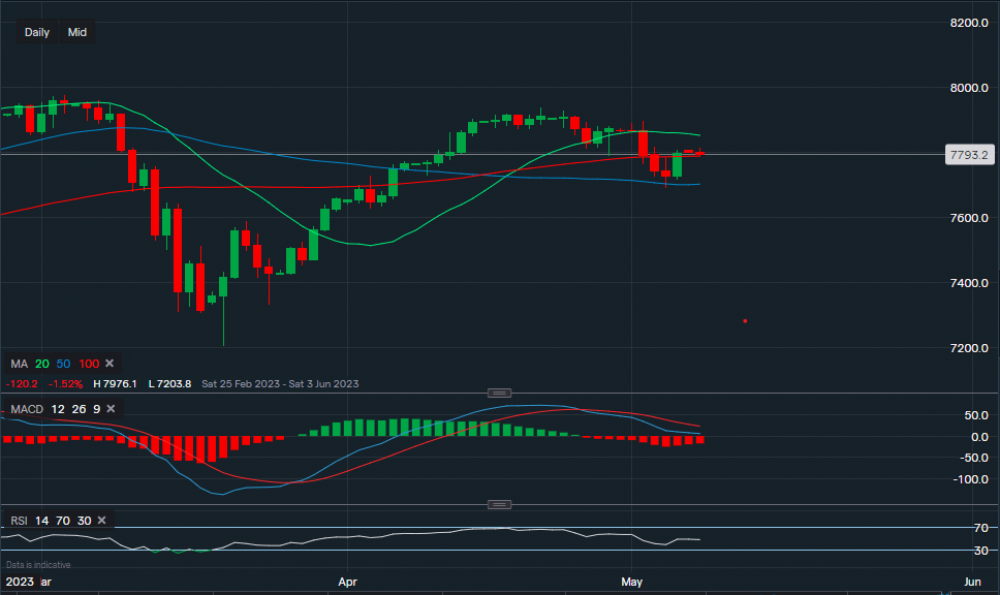
Taking a look at the FTSE 100 index after it had a strong day Friday post its recent retracement. The FTSE 100 reverted back after a couple of weeks of straight upside, testing the support of the 50-day moving average on the daily timeframe. On Friday it had a strong day closing above the 100-day moving average at 7,797 (100 MA point to 7,787). Following the rise, the 100 MA is now acting as support at 7,787 followed by support along the 50 MA at 7702. A break and close below the 50 MA could see the index slide further towards around 7,600. On the other hand, towards the upside, resistance sits at 7,852 (20-day MA) and then at 7,897. A break above 7,897 could see a stretch towards the high of 7,938, which in turn may lead to an attempt of reaching all-time highs again. Looking at the technical indicators, MACD is negative but volume is lowering and RSI is neutral as it reads 49.

Tradable assets:
Min.Deposit:
Max Leverage:
FCA:

Rating:
 Earnings Calendar
  Economic Calendar
  VAT Calculator
  Tax Free Childcare Calculator
 Percentage Calculator
 Compound Interest Calculator
  Loan Overpayment Calculator
 Mortgage Calculator
 Credit Card Calculator
 Investing
  Economics
 Trading
  Technical Analysis
  Personal Finance
 Calculator


