Visa (NYSE:) Technical Analysis: Earnings in Focus as Bullish Momentum Builds
$364.68
28 Jul 2026, 15:59
Neutral

Join Minipip Academy and access free courses in investing, trading, economics, and more.
Sign Up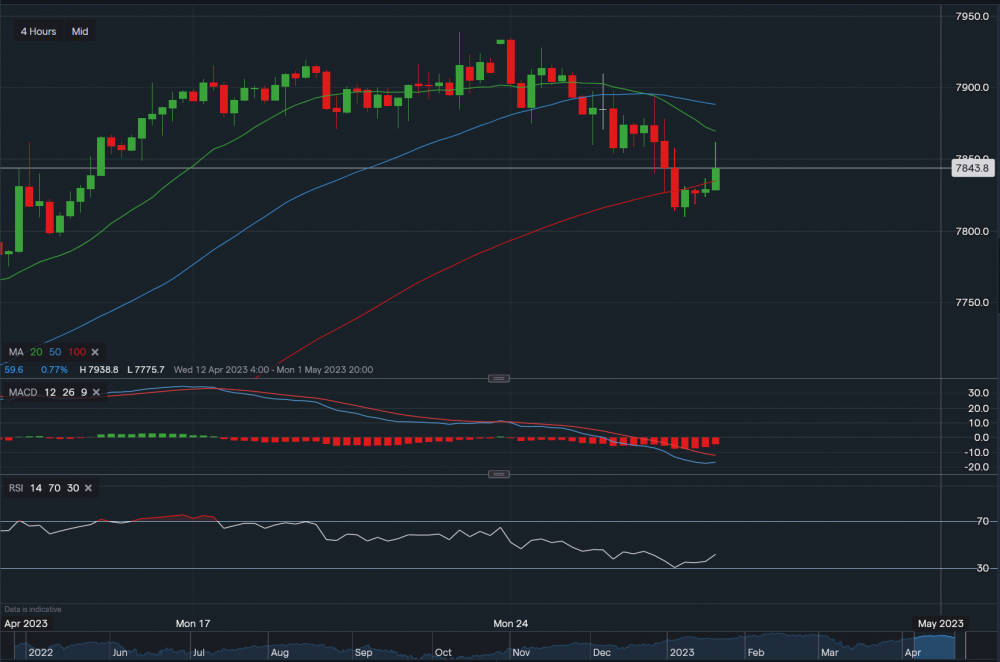
Chart & Data from IG
Taking a look at the FTSE 100 after its recent retracement. The index has reached the support along the 100-day moving average (7,827) on the 4 hourly timeframe, now trading around 7,843 and trying to consolidate. Current support sits at 7,835 followed by 7,810, a break below 7,810 could see the index fall further towards 7,760. Looking towards the upside, resistance sits at 7,869 (20-day MA) followed by 7,888 (50-day MA). A break above the 50-day moving average may see the FTSE climb back up towards that level of 7,930. Over to the technical indicators, MACD is still negative but looks like it's searching for that neutral stance and so is RSI as it now reads 43.
 Earnings Calendar
  Economic Calendar
  VAT Calculator
  Tax Free Childcare Calculator
 Percentage Calculator
 Compound Interest Calculator
  Loan Overpayment Calculator
 Mortgage Calculator
 Credit Card Calculator
 Investing
  Economics
 Trading
  Technical Analysis
  Personal Finance
 Calculator


